config-i1
commented
2 years ago
config-i1
commented
2 years ago Looks like an issues with classes. Can you please provide a reproducible example (always do that if you can)?
Closed Steviey closed 2 years ago
config-i1
commented
2 years ago Looks like an issues with classes. Can you please provide a reproducible example (always do that if you can)?
 Steviey
commented
2 years ago
Steviey
commented
2 years ago The reproduce able example works fine so far. Now I have a difference between the example code and a 30K-line-script :-). Which let me think, it could be related to the data-source. What does the cross in the graph mean? Noticed 1: Even LASSO and RIDGE are working now -not in the 'live-code'...have to investigate... Noticed 2: Changing the model-def can lead to failure because of src (normal ETS-behaviour) Noticed 3: Setting cumulative=FALSE leads to 'Failed to return valid external regressors.' src-variance issue (normal) Noticed 4: Shuffling the data can lead to the initial issue (example code updated).
options(scipen = 999)
options(dplyr.summarise.inform=F)
options(max.print=2000)
library("Hmisc")
suppressPackageStartupMessages(library(lightgbm))
suppressPackageStartupMessages(library(digest))
suppressPackageStartupMessages(library(RSQLite))
suppressPackageStartupMessages(library(stringr))
suppressPackageStartupMessages(library(tidyr))
suppressPackageStartupMessages(library(dbplyr))
suppressPackageStartupMessages(library(rlang))
suppressPackageStartupMessages(library(freqdist))
suppressPackageStartupMessages(library(tidymodels))
options(tidymodels.dark = TRUE)
suppressPackageStartupMessages(library(modeltime))
suppressPackageStartupMessages(library(modeltime.ensemble))
suppressPackageStartupMessages(library(modeltime.resample))
suppressPackageStartupMessages(library(timetk))
suppressPackageStartupMessages(library(tidyverse))
suppressPackageStartupMessages(library(rsample))
suppressPackageStartupMessages(library(tidyquant))
suppressPackageStartupMessages(library(tibbletime))
suppressPackageStartupMessages(library(anomalize))
suppressPackageStartupMessages(library(smooth))
suppressPackageStartupMessages(library(lmtest))
suppressPackageStartupMessages(library(mgcv))
suppressPackageStartupMessages(library(fable))
suppressPackageStartupMessages(library(fabletools))
suppressPackageStartupMessages(library(tsibble))
suppressPackageStartupMessages(library(tsibbledata))
suppressPackageStartupMessages(library(tsfeatures))
suppressPackageStartupMessages(library(ggplot2))
suppressPackageStartupMessages(library(ggrepel))
suppressPackageStartupMessages(library(runner))
suppressPackageStartupMessages(library(ggformula))
suppressPackageStartupMessages(library(fANCOVA))
suppressPackageStartupMessages(library(stats))
suppressPackageStartupMessages(library(TTR))
suppressPackageStartupMessages(library(xts))
suppressPackageStartupMessages(library(vip))
suppressPackageStartupMessages(library(yardstick))
suppressPackageStartupMessages(library(plotly))
suppressPackageStartupMessages(library(catboost))
suppressPackageStartupMessages(library(treesnip))
suppressPackageStartupMessages(library(broom))
suppressPackageStartupMessages(library(finetune))
suppressPackageStartupMessages(library(tabnet))

prepModteltimeData<-function(df){
    ret<-list()
    rownames(df) <- NULL
    df      <-  df %>% dplyr::mutate(id=row_number()) %>% relocate(id)
    ret$df  <-  df
    df_tsbl <-  df %>%
        as_tsibble(index=id)

    df_split    <- rsample::initial_time_split(df_tsbl, prop = 0.8)
    train_len   <- length(df_split$in_id)
    test_len    <- length(df_split$out_id)

    df_tsbl     <- as.data.frame(df_tsbl) # modeltime input format

    splits <- df_tsbl %>%
        timetk::time_series_split(assess=test_len, cumulative = TRUE)#kann auch int rein!

    ret$df_train    <- rsample::training(splits)
    ret$df_test     <- rsample::testing(splits)

    ret$df_split<-df_split
    ret$ts_split<-splits

    myH<-1
    myLimit          <- as.numeric(nrow(df_tsbl)-myH)
    ret$trainOneStep <- df %>% filter(id <= myLimit)
    ret$testOneStep  <- df %>% filter(id > myLimit)

    return(ret)
}
getFormulaLocalEn<-function(xRegCols){
    xRegCols  <- xRegCols[xRegCols!='value']
    xRegCols  <- xRegCols[xRegCols!='id']
    xRegCols  <- xRegCols[xRegCols!='date']

    myFormula <- xRegCols
    myFormula <- paste0(myFormula, collapse= "+")
    myFormula <- paste0('value ~ date + ',myFormula)
    myFormula <- as.formula(myFormula)
    return(myFormula)
}

y<-rnorm(120, mean=15, sd=5)
x<-c(
   rep(0.08,20)
   ,rep(0.20,20)
   ,rep(0.40,20)
   ,rep(0.60,20)
   ,rep(0.80,20)
   ,rep(1.0,20)
   )
x1<-c(
   rep(0.18,20)
   ,rep(0.21,20)
   ,rep(0.10,20)
   ,rep(0.61,20)
   ,rep(0.81,20)
   ,rep(1.0,20)
   )

data        <-data.frame(value=y,xReg=x,xReg1=x1)
# shuffle (new)
rows        <-sample(nrow(data))
data        <-data[rows, ]

dataLength  <-nrow(data)
myTime      <-tk_make_timeseries("2011", length_out=dataLength, include_endpoints = FALSE)
data$date   <-myTime

dataObj     <-prepModteltimeData(data)
df_train    <-dataObj$df_train
df_test     <-dataObj$df_test
allData     <-dplyr::bind_rows(df_train,df_test)

df_split    <-rsample::initial_time_split(df_train, prop = 0.75)
train_len   <-length(df_split$in_id)
test_len    <-length(df_split$out_id)

myFormula   <-getFormulaLocalEn(c('xReg','xReg1'))
recipe_spec <- recipe(myFormula,df_train)

set.seed(123)
cvResamples <- allData %>%
    time_series_cv(
        assess   = test_len
        ,initial = train_len
        ,slice_limit = 10
    )

lossVect = c("RIDGE","LASSO","GTMSE","likelihood","MSE","MAE","HAM","MSEh","TMSE","MSCE")

algoGrid <- expand.grid(
    lossParam=lossVect
    ,dummy=c('A')
    ,stringsAsFactors   = FALSE
    ,KEEP.OUT.ATTRS     = FALSE
)

results <- vector(mode = 'numeric', length = nrow(algoGrid))
idx<-0
for(ee in seq_len(nrow(algoGrid))){
    params  <- algoGrid[ee, ]
    myLoss  <- as.character(params[1,'lossParam'])
    print(myLoss)

    model_spec  <- adam_reg(
        ets_model      = 'ANN'
        ,loss          = myLoss
        ,distribution  = 'ds'
    ) %>%
    set_engine("adam",silent=FALSE,h=1)
    model_spec<-parsnip::eval_args(model_spec)

    set.seed(123)
    wflw<- workflow() %>%
        add_model(model_spec) %>%
        add_recipe(recipe_spec)

    error<-tryCatch({
        set.seed(123)
        wflw_fit<-fit(wflw,df_train)
        error<-0
    }, warning = function(w) {
        print(w)
        return(0)
    }, error = function(e) {
        print(e)
        return(1)
    })
    if(error>0){
        msg<-paste('Loss-Function failed...',title)
    }else{
        print('kein Error')
    }
}

infoTest <- cvResamples$splits[[1]] %>% analysis()
infoTest %>% glimpse()
infoTrain <- cvResamples$splits[[1]] %>% assessment()
infoTrain %>% glimpse()

myPlot<-cvResamples %>%
    tk_time_series_cv_plan() %>%
    plot_time_series_cv_plan(
        date, value,
        .facet_ncol  = 1,
        .interactive = TRUE
    )

View(cvResamples)
View(infoTrain)
View(infoTest)
#print(myPlot)
stop('Finished!')
Shuffled except date-var:

Steviey
commented
2 years ago holdout seems to play a role...
model_spec  <- exp_smoothing(
        error           = 'additive'
        ,trend           = 'none'
        ,season          = 'none'
        # ,damping          = 1
        # ,smooth_level     = 1
        # ,smooth_trend    = param6
        # ,smooth_seasonal = param7
    ) %>%
    set_engine("smooth_es",holdout=TRUE,silent=FALSE)
    model_spec<-parsnip::eval_args(model_spec)
smooth::es() (via modeltime wrapper) Noticed 5: msg: <simpleWarning: The exogenous variables contain NAs! This may lead to problems during estimation and in forecasting. Substituting them with 0.>
... is preventing the plotting in smooth (via modeltime)... code add...
colVect     <-  c('value','xReg')
data        <-  data %>% dplyr::mutate_at(all_of(colVect),as.numeric)
data        <-  data %>% dplyr::mutate(xReg=lag(xReg,n=1))
# comment this out to get the effect...
data        <-  data %>% dplyr::mutate_at(vars(matches("xReg")), ~tidyr::replace_na(.x,mean(.x,na.rm=T)))
Update: msg-issue: Solved, must be an internal from modeltime/tidymodels, because plotting of extracted model works as expected. Even with NA-msg.
Plotting an extracted model via smooth:
wflw_fit<-fit(wflw,df_train)
        myModel<-wflw_fit[['fit']][['fit']][['fit']][['models']][['model_1']]
        myPlot<-plot(myModel,7)
        print(myPlot)
        stop()
Doing the same (plotting extracted model) with ADAM brings:
Fehler in if (any(noVariability) && any(all.vars(formulaToUse) %in% names(noVariability))) { : Fehlender Wert, wo TRUE/FALSE nötig ist
myModel <- adam(df_train,"ANN", silent=FALSE,h=12, holdout=TRUE)
    myPlot  <- plot(myModel,7)
    #myPlot<-ggplotly(myPlot)
    print(myPlot)
stop()Can't reproduce it native.
Steviey
commented
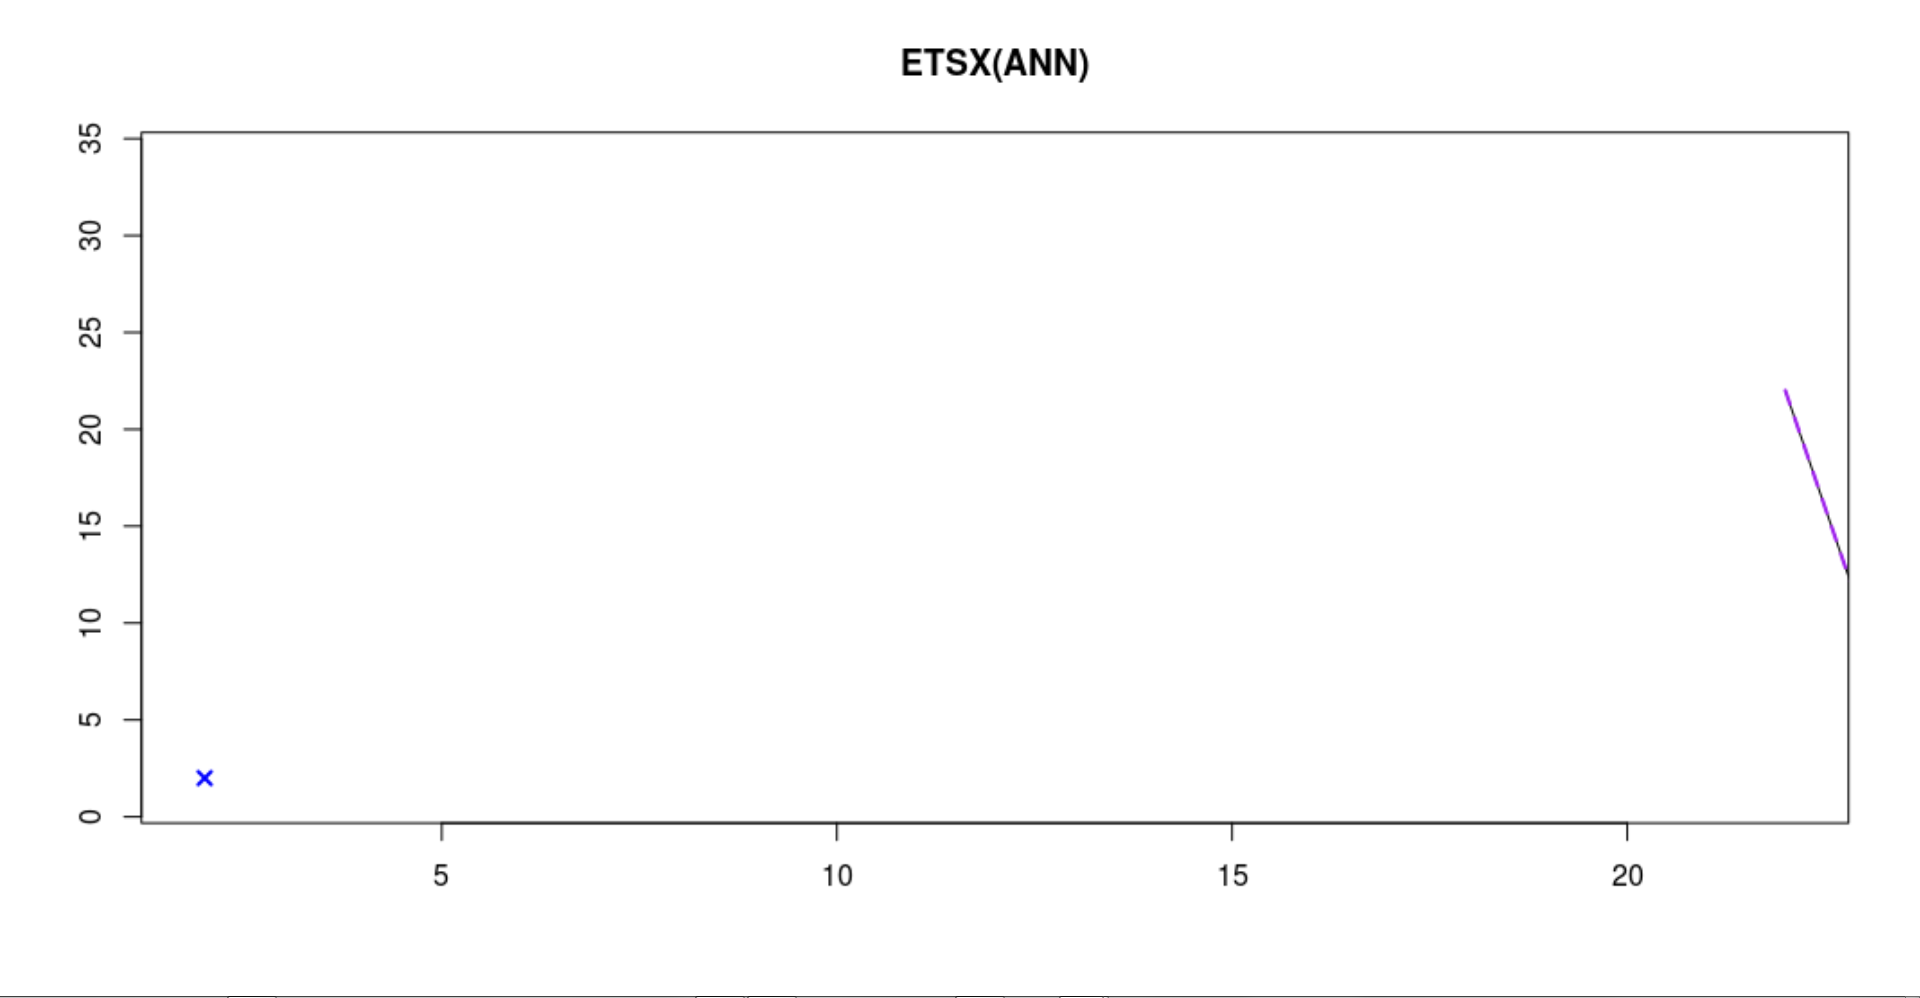
2 years ago I can reproduce the chart-design (native) by setting h=1
idx=120
    y<-rnorm(idx, mean=15, sd=5)
    x<-cbind(
        x1 =  rnorm(idx, mean=15, sd=5)
        ,x2 =  rnorm(idx, mean=15, sd=5)
    )

    fitXregs    <- data.frame(x=x,y=y,stringsAsFactors=F)
    fitXregs    <- fitXregs %>% dplyr::relocate(y)
    myModel <- adam(fitXregs,"ANN",silent=FALSE,h=1,holdout=TRUE)
I' m not sure if this is right- comparing to the book-chapter....

https://openforecast.org/adam/SES.html
Hinting with ggplot+plotly
idx=120
    y<-rnorm(idx, mean=15, sd=5)
    x<-cbind(
        x1 =  rnorm(idx, mean=15, sd=5)
        ,x2 =  rnorm(idx, mean=15, sd=5)
    )

    fitXregs    <- data.frame(x=x,y=y,stringsAsFactors=F)
    fitXregs    <- fitXregs %>% dplyr::relocate(y)

    myModel <- adam(fitXregs,"ANN",silent=TRUE,h=10,holdout=FALSE)
    #myModel <- smooth::es(df_train,model='ANN',h=1,holdout=TRUE,silent=TRUE)

    y           <-myModel[['data']][['y']]
    myFitted    <-myModel[['fitted']]
    myResiduals <-myModel[['residuals']]
    myFc        <-myModel[['forecast']]

    myFuture    <- data.frame(forecast=myFc)

    myData      <- data.frame(actual=y,fitted=myFitted,residuals=myResiduals)
    dataLen     <- nrow(myData)
    myData      <- dplyr::bind_rows(myData,myFuture)
    myData      <- myData %>% dplyr::mutate(id=row_number()) %>% relocate(id)
    myIntercept <- myData[dataLen,'id']

    # wide to long
    library(reshape2)
    subToLong = myData[,c(1,2,3,5)]
    myData    = melt(subToLong, id=c("id"))

    myPlot      <- ggplot(myData)
    myPlot      <- myPlot + geom_line(aes(x=id, y=value, colour=variable))
    myPlot      <- myPlot + geom_vline(xintercept=myIntercept, linetype="dashed", color = "#FF6900",size = 0.5)
    myPlot      <- myPlot + scale_colour_manual(values=c("black","red","blue"))

    myPlot      <- ggplotly(myPlot)

print(myPlot) 
Noticed 6: It also has a problem with: 'h=1'. Since modeltime had the same for a while, it seems to be a common problem in fc-plots. Anyway, this hint was fun :-).

Finally: fixing the hint... finding the lost one step forward fc (h=1, ~conditional mean)... :-).

     [...]

    dataLen1    <- nrow(myData)
    hintPoint   <- myData[dataLen1,c('id','value')]

    myPlot      <- ggplot(myData)
    myPlot      <- myPlot + geom_line(aes(x=id, y=value, colour=variable))
    myPlot      <- myPlot + geom_vline(xintercept=myIntercept, linetype="dashed", color = "#FF6900",size = 0.5)
    myPlot      <- myPlot + scale_colour_manual(values=c("black","red","blue"))
    myPlot      <- myPlot + ggtitle(title)
    myPlot      <- myPlot + geom_point(data=hintPoint,aes(x=id, y=value), colour="green",size=3)
    myPlot      <- ggplotly(myPlot)

print(myPlot)Are you using the most recent version of the smooth package? I cannot reproduce this. Here is what I get for the first part of your code:

Also please make sure that you use the latest version of the greybox package
Steviey
commented
2 years ago I noticed yesterday, that my local versions are way to old. I am working on multiple instances, sorry.
Steviey
commented
2 years ago Windows 7, greybox 1.0.5.41001, smooth 3.1.6.41004, R version 4.0.5 I get the following:
idx=120
    y<-rnorm(idx, mean=15, sd=5)
    x<-cbind(
        x1 =  rnorm(idx, mean=15, sd=5)
        ,x2 =  rnorm(idx, mean=15, sd=5)
    )

    fitXregs    <- data.frame(x=x,y=y,stringsAsFactors=F)
    fitXregs    <- fitXregs %>% dplyr::relocate(y)
    myModel <- adam(fitXregs,"ANN",silent=FALSE,h=10,holdout=TRUE)
idx=120
    y<-rnorm(idx, mean=15, sd=5)
    x<-cbind(
        x1 =  rnorm(idx, mean=15, sd=5)
        ,x2 =  rnorm(idx, mean=15, sd=5)
    )

    fitXregs    <- data.frame(x=x,y=y,stringsAsFactors=F)
    fitXregs    <- fitXregs %>% dplyr::relocate(y)
    myModel <- adam(fitXregs,"ANN",silent=FALSE,h=1,holdout=TRUE)
config-i1
commented
2 years ago The same code can be simplified to (for reproducibility purposes, so that I do not need to load tidyverse packages):
idx <- 120
x<-cbind(
    y = rnorm(idx, mean=15, sd=5),
    x1 =  rnorm(idx, mean=15, sd=5),
    x2 =  rnorm(idx, mean=15, sd=5)
)

fitXregs <- as.data.frame(x, stringsAsFactors=F)
myModel <- adam(fitXregs,"ANN",silent=FALSE,h=10,holdout=TRUE)
But this is what I get:

And this is with h=1:

So, I still cannot reproduce this.
config-i1
commented
2 years ago I assume that this can be closed now.
Steviey
commented
2 years ago Should be environment related.
Hello, I get different model-graphs with the same data and model-definitions in adam, auto_adam and smooth::es() when setting silent=FALSE. Is this normal, and what do the x-axes of the plots represent?
I also get this graph fitting ADAM, while cross validation for loss-function. What does the x on the left side mean?