Closed cculver closed 4 years ago
The default configuration properties for the consumer are tuned for very high throughput, and when something is wrong, they aren't forgiving in terms of the amount of bandwidth you can use... you could start by tweaking the following properties to prevent the consumer aggressively caching messages, which will give you a safety-net:
QueuedMinMessages
QueuedMaxMessagesKbytes
FetchMessageMaxBytes
FetchMaxBytes
(corresponding librdkafka property names)
queued.min.messages
queued.max.messages.kbytes
fetch.message.max.bytes
fetch.max.bytes
There shouldn't be a lot of overhead on top of the actual payload data. I'm not sure what is wrong from the information given - it could be that you're using the consumer in a way that isn't intended or a network related problem. If you provide your consumer code and/or output from setting the Debug
config property to all
, we can comment further.
Thanks for the tips. I left the settings the same for now and started with logging. I let it run for a little over a minute and I've got 2MB of log data (attached). Please let me know if you see anything because it's a little to foreign for me to understand if something's wrong. Thanks for your assistance.
Ahh, ok, you might want to try setting FetchWaitMaxMs
to something like 5000
or even longer (but well under SocketTimeoutMs
which defaults to 60000) and see what that does to bandwidth (both what you measure with wireshark and what ccloud charges you for). At the moment, the consumer is doing fetch requests to each broker (there are 12 of them) every ~100-150ms and the total request/response size of each is about 200 bytes in the case no data is returned. This is roughly 16kb/s. My understanding is ccloud wouldn't charge you for that overhead, if it is, i very much want to know!
It definitely is being charged to us. We're basically not using it on a day to day basis and we're seeing 4 - 6GB of network traffic charged to our account daily. See the attached bill as of right now for the month of April. As it stands, we're going to owe money for not using the service. It's really ridiculous if you ask me.
I'll make those changes and report back.
And just to clarify, I'm not saying it's ridiculous that we have to pay for a cloud service (I'm not unreasonable), but it's ridiculous that we're close to exceeding the $50 allotment while barely using the service.
I've just confirmed that we don't charge for the fetch request / response overhead. It's also noteworthy that your charges are all egress, not ingress (whereas the protocol fetch request size is actually larger than the response when empty), so the data billed all corresponds to the consumer pulling down actually message data. can you paste your code (the main consume loop would be a good start)?
Ok, that's a relief. It must be due to something on our side. We recently added some more logging in an effort to figure this out. We haven't seen any errors (or event messages indicating consumption) since I put these lines in, but that doesn't mean we don't have a rogue developer.
Here's our code. It's based on the code published under Examples/ConsumerExample.
_consumer.Subscribe(_topicName);
try
{
while (true)
{
ConsumeResult<TKey, TValue> consumeResult = null;
try
{
consumeResult = _consumer.Consume(TimeSpan.FromSeconds(240));
if (consumeResult == null || consumeResult.IsPartitionEOF)
{
continue;
}
_logger.LogDebug("Consuming message: Key {Key}, Offset {Offset}, Partition {Partition} in {type}", consumeResult.Topic, consumeResult.Message.Key, consumeResult.Offset.Value, consumeResult.Partition.Value, this.GetType().FullName);
await HandleMessage(consumeResult);
_logger.LogDebug("Message consumed: Key {Key}, Offset {Offset}, Partition {Partition} in {type}", consumeResult.Topic, consumeResult.Message.Key, consumeResult.Offset.Value, consumeResult.Partition.Value, this.GetType().FullName);
try
{
_consumer.Commit(consumeResult);
}
catch (KafkaException e)
{
_logger.LogError(e, "Consumer error encountered during commit: Key {Key}, Offset {Offset}, Partition {Partition} in {type}", consumeResult.Topic, consumeResult.Message.Key, consumeResult.Offset.Value, consumeResult.Partition.Value, this.GetType().FullName);
}
}
catch (ConsumeException e)
{
if (consumeResult == null)
_logger.LogError(e, "Consumer error encountered.");
else
_logger.LogError(e, "Consumer error encountered: Key {Key}, Offset {Offset}, Partition {Partition} in {type}", consumeResult.Topic, consumeResult.Message.Key, consumeResult.Offset.Value, consumeResult.Partition.Value, this.GetType().FullName);
}
}
}
catch (OperationCanceledException)
{
_consumer.Close();
}
If that looks good, let me get back to my team and see if we can look into a few things on our side. Thanks for your help.
Is it correct to say that if we have deserialization problems (through changing json schemas or otherwise), that this code will never commit the message and will therefore continue to pull the same message over and over? That's a possible explanation
An update on this: there's a discussion thread about this internally ongoing from yesterday. it appears from that thread that we do currently charge for this overhead, but there's a new usage tracking system under development where there is a plan is to change this (that this is in flux resulted in me confirming the reverse above, sorry about that). I believe you've already been talking to support? i recommend continuing that conversation re charges.
Setting FetchWaitMaxMs
high will dramatically reduce overhead, and you shouldn't really see an impact in your scenario. Set it to 30000 should be fine. I also recommend adjusting the other config properties i mentioned, but increasing the timeout on the fetch long-poll is the main thing.
sorry about this! i completely agree it's not good that you can get a surprise like this.
the consume loop is fine - you're operating synchronously, but that is fine (and simpler) if your throughput requirements are relatively low.
Ok, much appreciated. I wasn't getting much information out of support. We didn't cover coding on that side. Kind of sit and wait, and I wanted to rule out development errors while I waited. Apologies for the confusion, but I appreciate your help.
support were probably waiting for a resolution out of the discussion, there's quite a bit going on there. no worries, hopefully you're on track now.
something i didn't consider before is that Kafka processes requests issued on a given connection one at a time. That means that if one of those requests blocks for a long time (which will be the case for fetch requests if fetch.max.wait.ms is high), then requests following it will also be blocked until the fetch request completes. for this reason, setting fetch.max.wait.ms
as high as 30000 may be problematic (though i'm not sure about the complete set of circumstances under which that may be the case). setting this to 1000 would be definitely be safe. I'm working on getting some solid guidance together on how high it is reasonable to set this and writing it up as a blog post.
Description
We are using Confluent Cloud with a testing environment with 17 topics, each with 6 partitions. Each topic has very few messages in it (<100 @ 1k per message). We noticed that our billing statement included an extremely excessive amount of bandwidth for how we were using it, to the point that our testing environment was almost exceeding our free allotment. It amounted to 4GB/day. For a very small environment, this made no sense to me. Using Wireshark, I decided to look at the network traffic for a single topic coming from my local environment going to Confluent Cloud over port 9092, to any of the 12 ip addresses for these hostnames: pkc-epwny.eastus.azure.confluent.cloud b0-pkc-epwny.eastus.azure.confluent.cloud b1-pkc-epwny.eastus.azure.confluent.cloud ... b11-pkc-epwny.eastus.azure.confluent.cloud
Each time we start up the single consumer for that single topic, we are seeing an inordinate amount of bandwidth being used by the consumer - approximately 40KB/sec for the first 240 seconds followed by some periods of lower activity, around 16KB/sec, and then back up and down and up again.
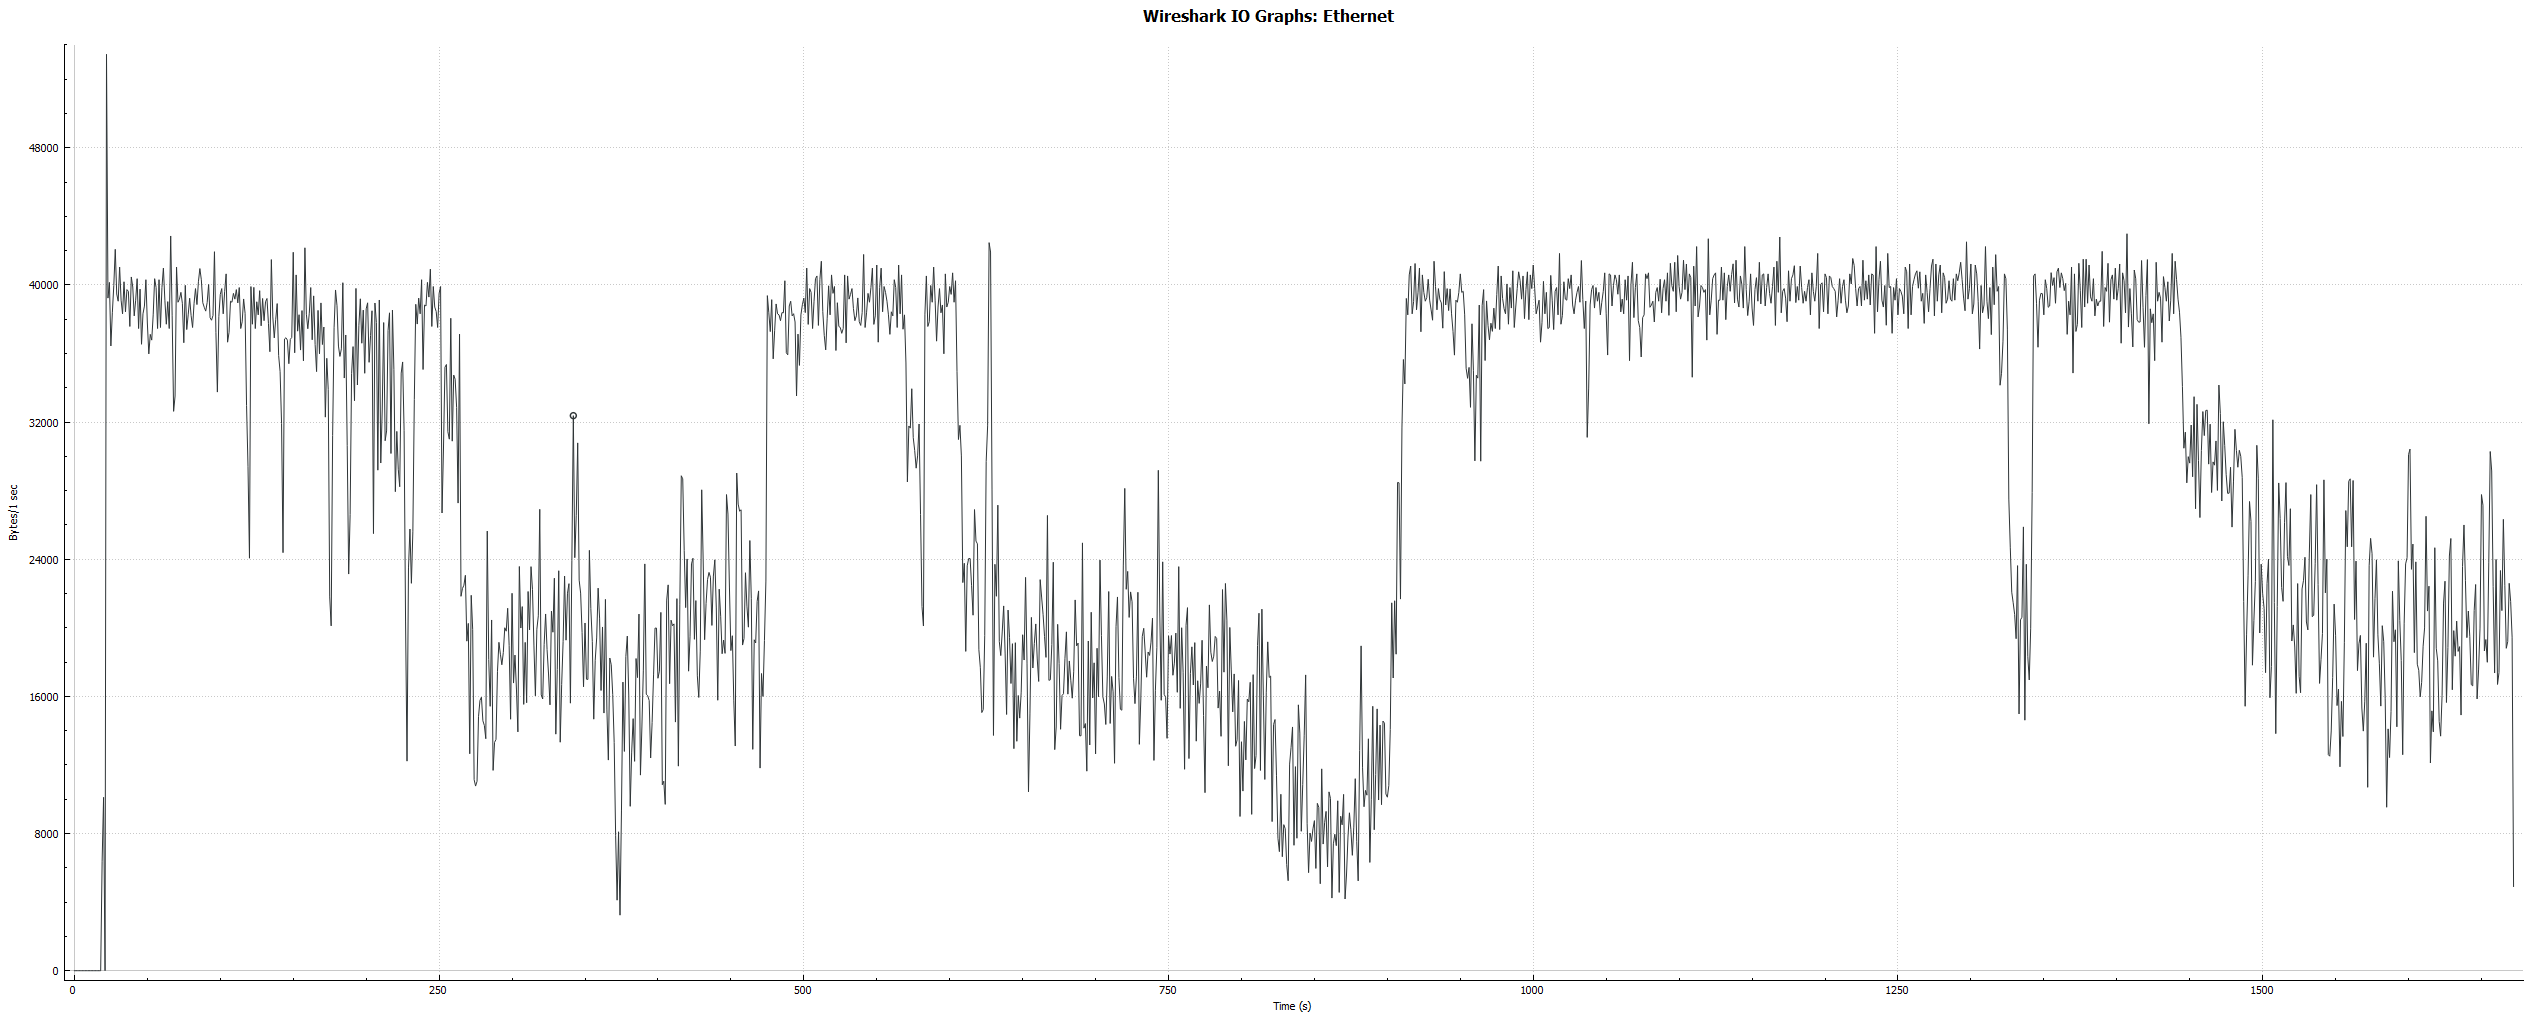
Outside of the connection/bootstrap settings, our consumer configuration is very simple, specifying our Group Id, Client Id, AutoOffsetReset=1, and EnableAutoOffsetStore=false. Am I doing something wrong here? Is there any explanation for the bandwidth issues we're seeing?
Edit: I also need to note that during this period, no messages are being produced to the topic. Because it's a testing environment, it's all very static. I should also note that I hooked up the confluent-kafka-dotnet git repo to the project so I could debug into it. All of this traffic is happening inside the call to the outside library function Librdkafka.consumer_poll().