 hjoliver
commented
6 years ago
hjoliver
commented
6 years ago @sadielbartholomew - thanks for looking into this; it seems like an excellent idea that we should definitely consider.
Open sadielbartholomew opened 6 years ago
hjoliver
commented
6 years ago @sadielbartholomew - thanks for looking into this; it seems like an excellent idea that we should definitely consider.
 oliver-sanders
commented
6 years ago
oliver-sanders
commented
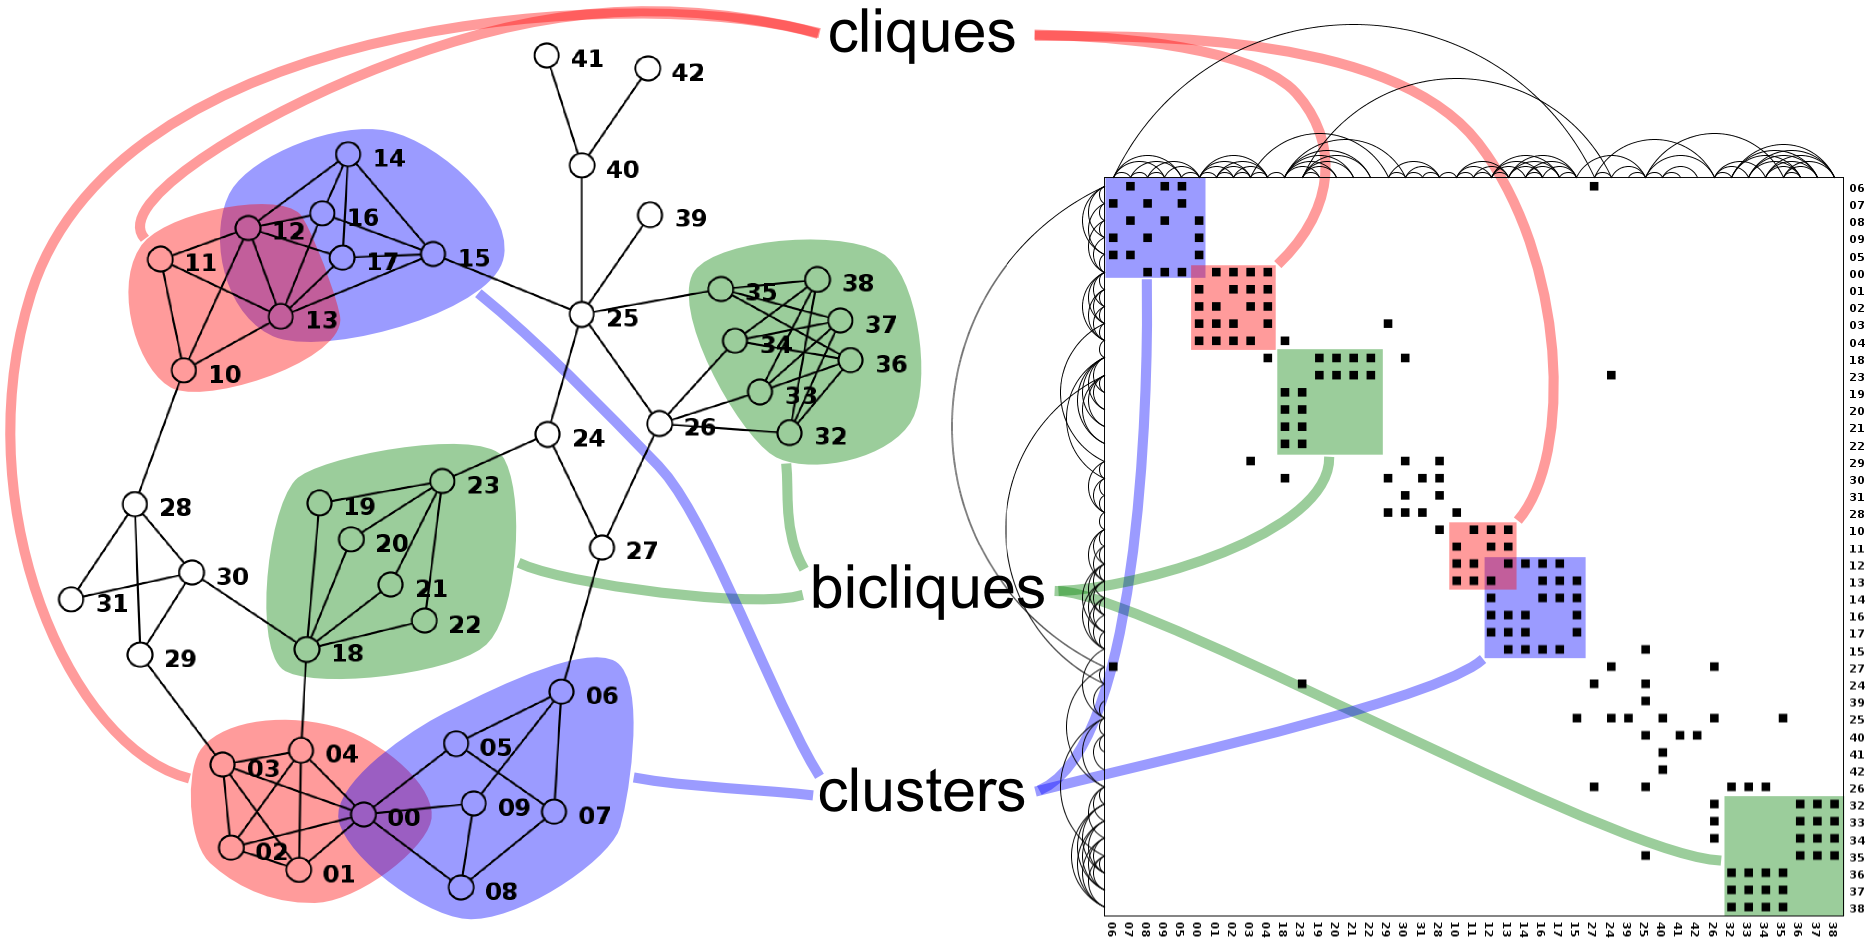
6 years ago A good idea, I haven't come across adjacency matrices, they are a bit intimidating at first but pretty easy to read once you understand what they are representing.
Having a quick think about how this view might be used...
The current views are task-orientated, this view is more dependency orientated as it is effectively a grid of dependencies with tasks as the axis. This makes it a natural complement to our non-graph views which don't display any dependency information. Adjacency matrices for directed graphs seem to put prereqs in one colour and postreqs in another, we could extend this to show whether a dependency has been satisfied. Such a view could:
Representation considerations:
hjoliver
commented
6 years ago  sadielbartholomew
commented
6 years ago
sadielbartholomew
commented
6 years ago Ah, that's a lovely post for a quick overview! Good find @hjoliver.
Apologies for perhaps over-referencing & for referencing rather heavy papers instead of introductory material which was probably more appropriate for context in my opening comment. In reply to your comment @oliver-sanders:
I'll continue to probe this idea in spare moments. A good next step will be taking a highly complex, e.g. a Met Office operational, suite & seeing how it translates into a matrix.
oliver-sanders
commented
6 years ago Displaying the whole matrix might be difficult for suites with many tasks, for example the MO global operational suite has ~2000 tasks, the matrix would be massive. I'm not quite sure what users would gain from visualising the whole matrix, it would be far too big to represent?
What might be a good idea is to display a smaller matrix consisting of the selected task and all other tasks within "n" nodes from that task in the graph (similar to what we are planning on doing with the graph view).
This means that all of the tasks in the matrix are closely linked in the graph keeping the view focused to the users activity, e.g. assessing the impact to the workflow of a failed task (which is the most significant use case I have thought of so far).
hjoliver
commented
6 years ago Well, I thought the point of this was it's a cleaner way to visualize large graphs - but fair enough, I'm sure it has it's limits! ... and we can restrict the range shown, as for the "node-link" view.
sadielbartholomew
commented
6 years ago The concept of an adjacency matrix in itself wouldn't especially help for 'jumbo' suites. This is where the quilt concept comes in. That is not to say the overall view will not have it's limits, of course it will, but I want to demonstrate that there is distinct value supplementary to existing views.
I have jotted down some diagrams & done a few back-of-the-envelope calculations (using your n=2000 base figure) to illustrate this. I'm attaching the diagram now for convenience but will leave the description until tomorrow (it's bedtime).
 hjoliver
commented
6 years ago
hjoliver
commented
6 years ago Interesting, looking forward to the explanation!
sadielbartholomew
commented
6 years ago Sorry, forgot to provide the description to those diagrams; I will get round to it eventually i.e. once I have located the paper I did my calculations on :grin:. Just to note I have found another paper outlining a neat creative way to tame mammoth graphs.
sadielbartholomew
commented
5 years ago Oops, eventually I will get some mock-ups & details written up here!
For now, popped in to say there that D3 have an amazing adjacency matrix layout. See the very cool demo here, where the rows & columns can be re-ordered e.g. to "cluster" the dependencies.
hjoliver
commented
5 years ago For now, popped in to say there that D3 have an amazing adjacency matrix layout.
Wow, that is nice :grin:
Context
It has become clear that many users run complex suites with an inordinate number of tasks for dependency visualisation, which is currently only manifest with our 'graph' (node-link) view & in such cases exhibits as an illegible muddle of intersecting edges.
Accordingly, I have been browsing the literature on visualisations for directed acyclic graphs to see if there are alternatives which are suited better to workflows containing (very) large numbers of tasks. [1] is a very good summary of different approaches.
Concept
In light of the above, I would like to tentatively propose a new 'view' i.e. visualisation mode for suites, to complement the 'graph', 'dot' & 'text' task views we will want to re-establish in improved form for our new GUI (https://github.com/cylc/cylc/issues/1873), either as part of its initial development, or as a later enhancement.
The underlying concept would be (dynamic) adjacency matrix depictions of (D)AGs, which are essentially boolean arrays for edge existence between nodes. Research shows that for layered graphs with more than ~20 nodes, matrix representations are consistently clearer, except in some cases for path-finding [2].
However, this can yet be improved on [3] with an adapted, condensed form denoted a 'quilt' [4]. "Quilts scale much more successfully to large graphs than our other two [sorted & 'centered & sorted'] matrix depictions." [5].
Status
Obviously the details of this idea need fleshing out, however the matrix-based underlying nature of this view lends itself intuitively to NumPy functionality. I will conduct some investigation into spatial requirements, scalability with 'skip links' & complications/subtleties I may have neglected as yet.
References