cytomining / cytominer-eval

Common Evaluation Metrics for DataFrames
BSD 3-Clause "New" or "Revised" License
7 stars 11 forks source link

Add option to summarize replicate z-scores from controls as medians #38

Open gwaybio opened 3 years ago

gwaybio commented 3 years ago

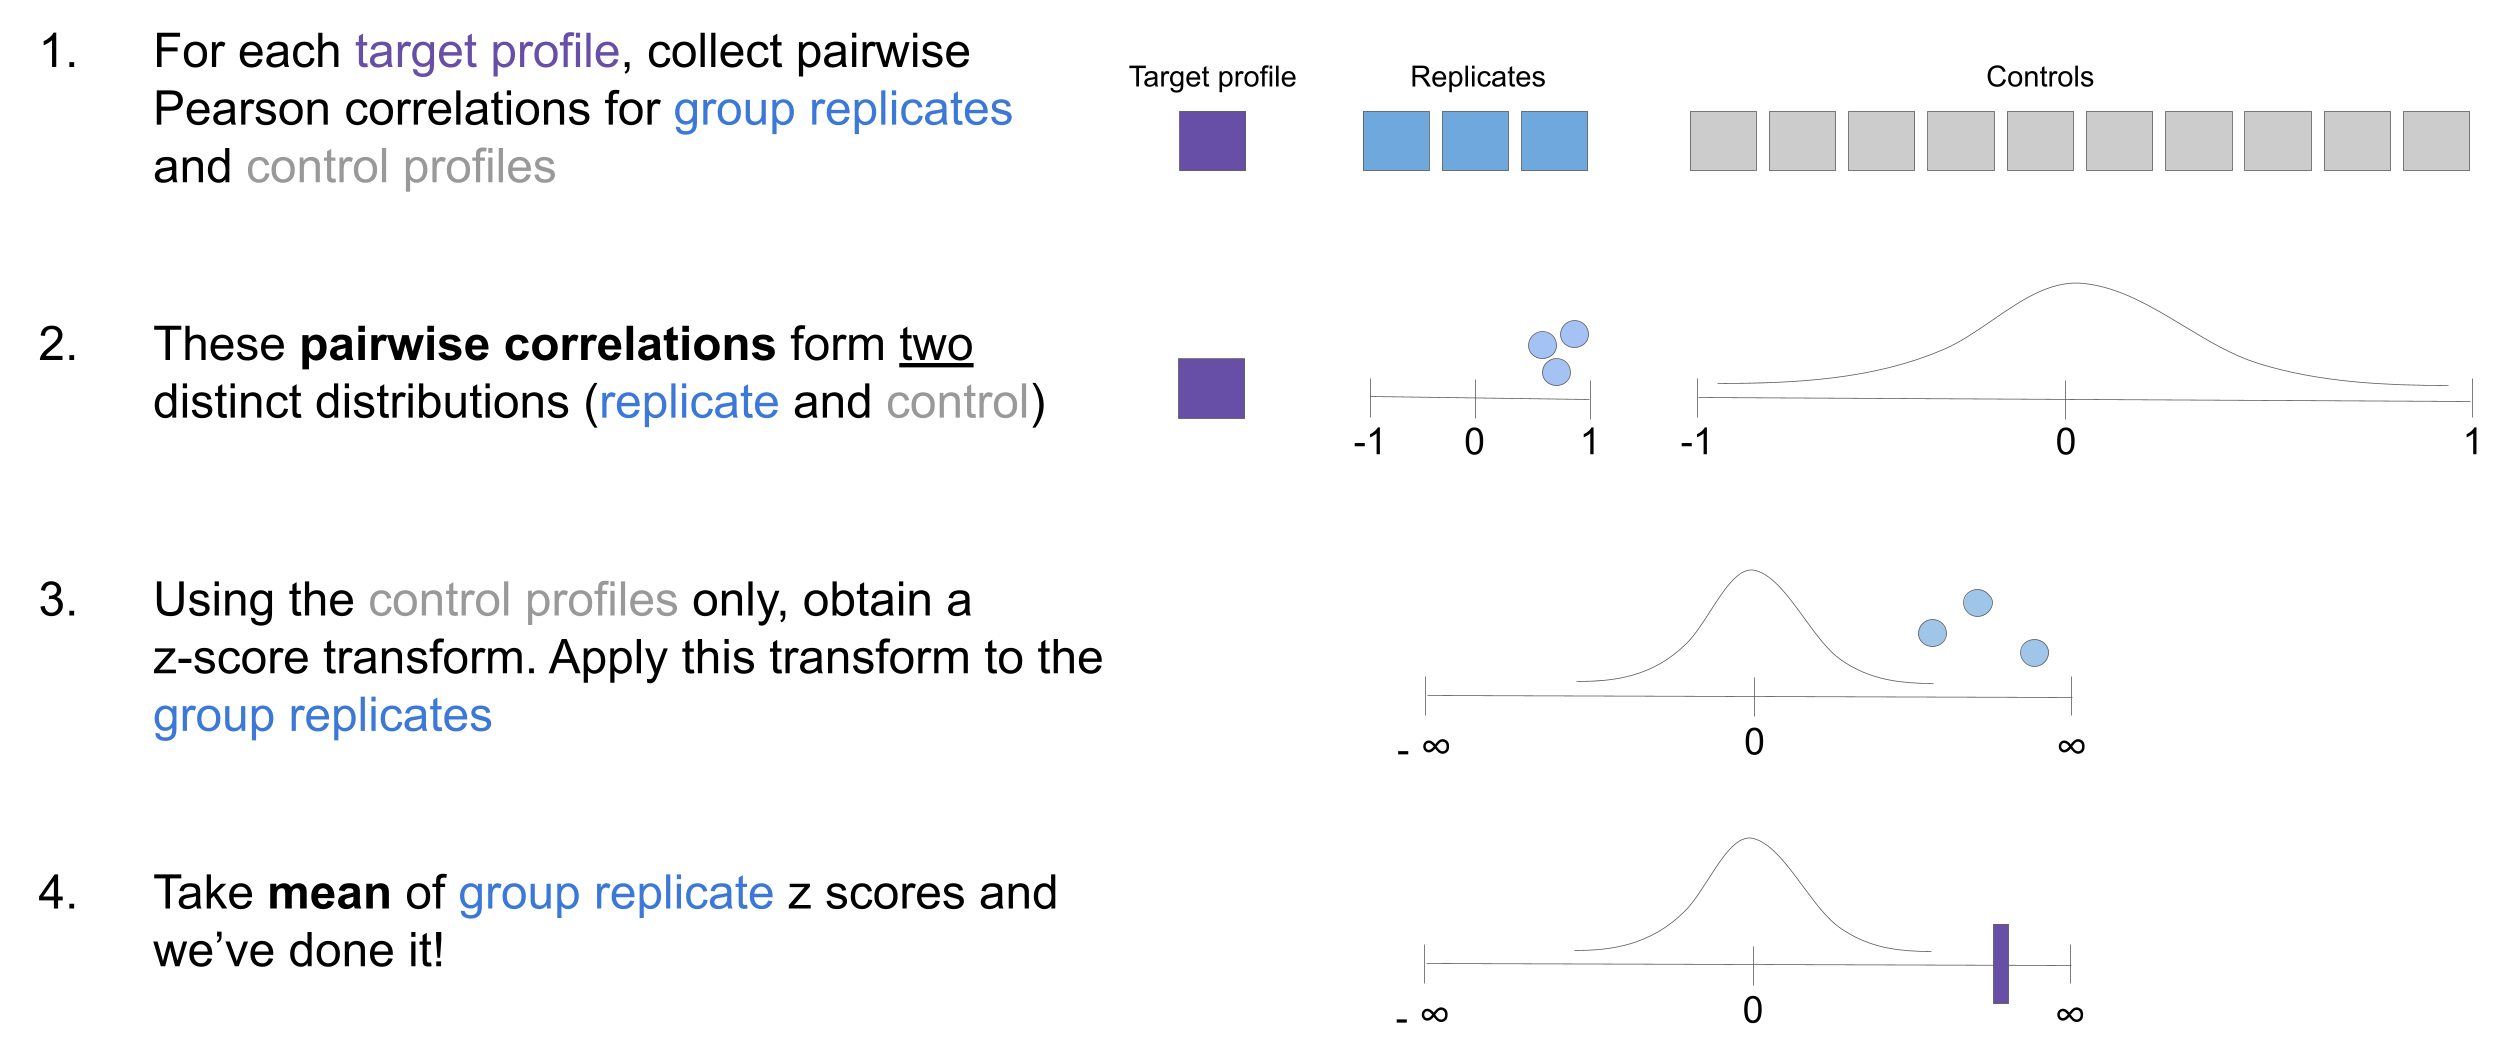
The only option is to define based on mean. I need to add an option to define based on median.

gwaybio commented 3 years ago

@shntnu noted in https://github.com/broadinstitute/neuronal-cell-painting/issues/6#issuecomment-767719260 that we should give more thought to using negative control correlation z-scores to transform replicate correlations because of skewed distributions.

It is also possible that Amoolya brought this up yesterday, and suggested using median instead of mean.

I thought that she was referring to step 4 in https://raw.githubusercontent.com/broadinstitute/grit-benchmark/main/media/grit_calculation.png. This is what I added as an option in #39.

@shntnu - is your interpretation different?

To me, z-scoring is suitable for grit - even in the presence of skewed pairwise correlations. If we think about z-scoring as a way to normalize the correlations and interpret how many perturbations will exist above/below the distribution then we are burned. However, if we think about using the z-score to find where the mean/median replicate correlation is in respect to the controls (which we do) then we are ok. Biologically, negative controls will have variance, and, in a CRISPR experiment, potentially different off-target effects. By comparing replicate correlations to this potentially skewed distribution will help us know how different, on average, are the replicates from all controls. This underscores the importance of quality controls, which is true for all experiments.

gwaybio commented 3 years ago

a nice succinct summary on uses and misuses of z-scores https://influentialpoints.com/Training/z_scores_use_and_misuse.htm

AnneCarpenter commented 3 years ago

I will need to rely on other experts here - if you don't think you have sufficient ones chiming in, please ask for help in finding them! Sounds like Amoolya may be all you need, if you can have her read drafts sooner rather than later it will help I'm sure.

Remember how you say that Grit ranges between -1 and + 1? If that is a mathematical relationship and not just by chance, then I suspect that range might only hold true for experiments where the distribution is relatively normal and not skewed too much. Just speculation though.

gwaybio commented 3 years ago

I will need to rely on other experts here

This doesn't give me confidence! (Just FYI) Do you mean you'd like a consensus opinion in order to move forward? If so, what does a consensus opinion look like?

Remember how you say that Grit ranges between -1 and + 1? If that is a mathematical relationship and not just by chance, then I suspect that range might only hold true for experiments where the distribution is relatively normal and not skewed too much. Just speculation though.

We can assume that random data follows a normal distribution. We cannot assume that every profile without signal will appear random. That is the cost of doing business :)

AnneCarpenter commented 3 years ago

I just meant please do not count on ME to judge whether decisions on this are sound. If you, or other experts you trust, feel confident about it then carry on :)

gwaybio commented 3 years ago

Gotcha! Thanks for clarifying. I choose @shntnu to trust :)

gwaybio commented 3 years ago

some more info: in broadinstitute/grit-benchmark#22 I calculated grit using mean and median summary, and plotted the results (pasted below). The y axis is grit calculated with median, and the x axis is grit calculated with mean. The difference is very minor. We observe slightly elevated grit scores using median, potentially because poorly targeting guides reduce the mean score.

cell_health_grit_metric_summary_comparison

Calculated mean vs. median has a range of Spearman rank correlation between 0.9798 - 0.9835 (see this notebook).

shntnu commented 3 years ago

However, if we think about using the z-score to find where the mean/median replicate correlation is in respect to the controls (which we do) then we are ok.

I agree with this and with the explanation in https://github.com/cytomining/cytominer-eval/issues/38#issuecomment-778229256.

I'd note that there are other, completely different ways of reporting the comparison of the two distributions (1. correlation to replicates and 2. corrections to negative controls) e.g. Average Precision (replicates = class 1, negative controls = class 2), but @gwaygenomics's choice of average z-score of class 1, using class 2 as a reference, is a defensible choice.