 daattali
commented
5 years ago
daattali
commented
5 years ago Can you please add a small fully reproducible example code
Closed wpetry closed 5 years ago
daattali
commented
5 years ago Can you please add a small fully reproducible example code
 wpetry
commented
5 years ago
wpetry
commented
5 years ago Sure thing, @daattali
Load packages & generate data
library(tidyverse)
library(ggExtra)
theme_set(theme_bw() + theme(panel.grid = element_blank()))
set.seed(503234)
dat <- tibble(x = rbeta(5000, shape1 = 5, shape2 = 1),
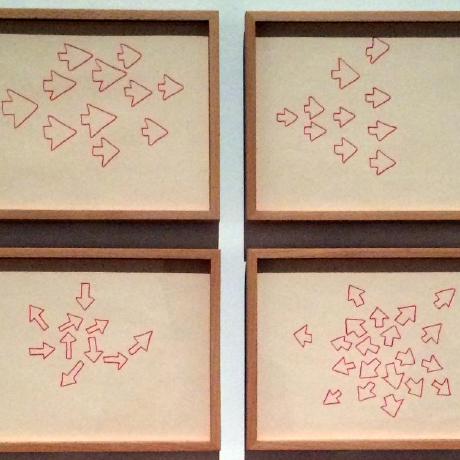
y = exp(rnorm(5000, mean = 0, sd = 2)))Using the default expand = TRUE works—the density plots cut off in line with the data. This is expected behavior.
p <- ggplot(dat, aes(x = x, y = y))+
  geom_point()+
  scale_y_log10()+
  coord_cartesian(xlim = c(0, 1), expand = TRUE)
ggMarginal(p, type = "density")
Using expand = FALSE misaligns the density plots. The lines should extend the whole axis extents, and this is particularly visible in the apparent zero density around x=1. This is unexpected behavior.
q <- ggplot(dat, aes(x = x, y = y))+
  geom_point()+
  scale_y_log10()+
  coord_cartesian(xlim = c(0, 1), expand = FALSE)
ggMarginal(q, type = "density")
I was able to fix it very crudely by adding a logical argument called expand to the function and replacing top[["coordinates"]][["expand"]] <- expand and right[["coordinates"]][["expand"]] <- expand. This clearly isn't the right way to do it, otherwise I'd send in a PR. Ideally an automated check of the original plot p would be run (including custom adjustments, e.g., scale_x_continuous(expand = c(0.5, 1)), and the top and right marginal plots would be adjusted accordingly.
Thanks for maintaining this great package.
daattali
commented
5 years ago Great, thanks for the detailed report and examples. I'm on mobile and rushing, but is this related/duplicate of https://github.com/daattali/ggExtra/issues/128 ?
wpetry
commented
5 years ago They're very closely related for sure (sorry for not referencing #128), but I think this may be a separate (or subset) of that issue that would be easier to fix.
daattali
commented
5 years ago Thanks for reporting. Feel free to take a look and tackle it in the proper way if you find some time!
On Fri, Jun 21, 2019, 17:20 Will Petry <notifications@github.com wrote:
They're very closely related for sure (sorry for not referencing #128 https://github.com/daattali/ggExtra/issues/128), but I think this may be a separate (or subset) of that issue that would be easier to fix.
— You are receiving this because you were mentioned. Reply to this email directly, view it on GitHub https://github.com/daattali/ggExtra/issues/145?email_source=notifications&email_token=AAHIQFDCR2LYOQ34CG73VH3P3VA2XA5CNFSM4H2T5XHKYY3PNVWWK3TUL52HS4DFVREXG43VMVBW63LNMVXHJKTDN5WW2ZLOORPWSZGODYJTUSA#issuecomment-504576584, or mute the thread https://github.com/notifications/unsubscribe-auth/AAHIQFDODCDF3OYQQ445RWLP3VA2XANCNFSM4H2T5XHA .
wpetry
commented
5 years ago I thought I had a solution for the CRAN version, but I see that the GH version has switched to R6. I'm afraid this is a bit out of my depth.
 crew102
commented
5 years ago
crew102
commented
5 years ago I'd be happy to integrate your solution into the current codas of ggExtra, so long as the fix you're talking about isn't too hairy.
crew102
commented
5 years ago Hi @wpetry , I looked into this and it basically amounts to #128. ggMarginal() currently doesn't handle the cartesian coordinate system well (i.e., it doesn't work well for plots that were built using the coord_cartesian() function). The reason why it seemed like there was a specific issue with the expand argument is b/c the coord_cartesian() call in your example didn't actually change the look of the plot. If you change the values for xlim in your example, you'll see that ggMarginal() fails to account for the cartesian coordinate system, even when expand = TRUE. In other words, the problem isn't the expand argument per se, but rather the inability of ggMarginal() to account for coord_cartesian().
library(ggplot2)
library(ggExtra)

set.seed(503234)
dat <- data.frame(
  x = rbeta(5000, shape1 = 5, shape2 = 1),
  y = exp(rnorm(5000, mean = 0, sd = 2))
)

p <- ggplot(dat, aes(x, y)) +
  geom_point() +
  scale_y_log10() +
  coord_cartesian(xlim = c(0, .5), expand = TRUE)

ggMarginal(p)
Created on 2019-06-29 by the reprex package (v0.2.0.9000).
daattali
commented
5 years ago Thanks for looking into it. Closing this as duplicate
In
ggMarginal, the marginal plots useexpand = TRUEeven if the user has specifiedpto haveexpand = FALSE. This leads to a misalignment of the data between the main plot and margins.