 jacobtomlinson
commented
1 year ago
jacobtomlinson
commented
1 year ago Thanks for raising such a thorough bug report, that really helps in nailing things down. I'll take a look.
Closed tasansal closed 1 year ago
jacobtomlinson
commented
1 year ago Thanks for raising such a thorough bug report, that really helps in nailing things down. I'll take a look.
jacobtomlinson
commented
1 year ago @tasansal I think I have a fix for this in #635. Do you have any interest in trying that PR out?
To test it you'll need to build a new docker image for the controller with the changes installed and reinstall the operator to use that.
FROM ghcr.io/dask/dask-kubernetes-operator:2022.12.0

RUN pip install git+https://github.com/jacobtomlinson/dask-kubernetes.git@scale-down
$ docker build -t <image>:<tag> .
$ docker push -t <image>:<tag> .$ helm install --repo https://helm.dask.org --create-namespace -n dask-operator --generate-name dask-kubernetes-operator --set image.name=<image> --set image.tag=<tag>Actually I'm still seeing issues with this fix in. I'll take another look at this tomorrow.
 tasansal
commented
1 year ago
tasansal
commented
1 year ago @jacobtomlinson I can test whenever needed; just let me know! Thanks for looking into this.
jacobtomlinson
commented
1 year ago I'm still unable to find a fix for this but I wanted to write up some notes from my debugging.
The problem seems to occur when the scheduler's desired number of workers fluctuates up and down.
The example given above mostly doesn't reproduce the issue for me, the cluster scales to 30 workers consistently and completes the work. However, on completion I have noticed workers being removed before the future result is passed back to the client resulting in the progress bars rolling back and recomputation happening.
If I set the maximum to 60 or 100 I start seeing the problem as described above. This is because the scheduler is asking for numbers of workers below the maximum and that number fluctuates. Increasing the data size causes the scheduler to pin to the maximum again and the problem goes away.
My understanding is that something is going wrong during scale down. As the progress bars get towards the end the scheduler ramps down the number of workers it requires and the controller starts removing workers. However it seems the scale down is not happening gracefully which causes results to be lost and the progress bars to roll back. This causes recalculation which causes the scheduler to ask for more workers again and the cluster scales up, then as the progress bars approach the end the same thing happens and results are lost again. This can happen many times and the cluster just thrashes up and down and work can fail to complete at all.
I'm surprised this is happening as k8s should send terminating pods a SIGTERM and then wait 30 seconds before sending a SIGKILL. This should be more than enough time for the worker to migrate its keys to another worker. Perhaps the worker handing of SIGTERM isn't working as I expect it to.
This scale down issue explains why deleting the DaskAutoscaler mid-calculation fixes things because the auto scale down is never attempted.
The fact that the cluster can end up in a state where there are fewer workers than the minimum is interesting. I think this is happening because multiple scale downs are happening at the same time and this removes too many workers. xref #603 which covers lost pods not being recreated. It's just in this case that the autoscaler is losing the pods.
Looking through the client-side adaptive implementation that is used in the classic KubeCluster there are a few things it does that aren't in the new implementation:
tasansal
commented
1 year ago Thanks for the detailed notes @jacobtomlinson; glad you can reproduce the issue. I don't have any experience with the Kopf based operators and the native k8s APIs. I would love to help you solve this, but I may slow you down :) Please let me know if I can help!
I think you're right that the scaling gets triggered too many times and conflicts with itself. That is what I observed from looking at operator logs yesterday. #603 seems related, yes.
This is a blocker for us to migrating to the new operator-based KubeCluster, and we would love to migrate to it because it makes the DevOps process more elegant, UX better, and still allows us to use the auto-scaling (as opposed to HelmCluster).
We need a persistent cluster that can auto-scale. Currently, we use classic KubeCluster. To enable auto-scaling we run another pod to have Adaptive deployment running (connect to the cluster, run .adapt). Once that pod dies, it stops scaling. And we want to manage all this with DevOps manifests. Any suggestions to deploy an adaptive cluster in a better way in the meantime?
I did notice the differences between the classic auto scaler as well. Maybe those mechanisms were put in place to avoid issues like this.
jacobtomlinson
commented
1 year ago That is what I observed from looking at operator logs yesterday.
Could you share these logs? It would be useful to see.
Any suggestions to deploy an adaptive cluster in a better way in the meantime?
Having a persistent KubeCluster that is reused is not a common pattern and the original implementation wasn't really designed to be used this way. Most users launch clusters dynamically within their workflows so I don't really have any recommendation on a better way to do that.
One of our goals with the operator is to enable the workflow you describe. This is why we have re-implemented the adaptive logic to live in the controller rather than in the KubeCluster object so that the cluster can continue autoscaling even without the KubeCluster object existing.
I did notice the differences between the classic auto scaler as well. Maybe those mechanisms were put in place to avoid issues like this.
It's quite possible and our autoscaling logic clearly needs some work in the new implementation.
 jmif
commented
1 year ago
jmif
commented
1 year ago I've just opened a couple PRs #648 and #649 which may help with this issue, we are seeing the same problems in some of our clusters (work being nearly completed, auto scaling spinning down workers, work being lost, auto scaling spinning back up).
There's a call out in #648 which suggests adding a maximum scale down rate which could help with this issue. We lost work when our cluster scaled down from 15 workers to 1 worker right as the cluster was finishing up properly. It could be that there simply weren't any workers to migrate to because the majority of them were scaling down. I'm not sure if those PRs solve the problem as its hard to reproduce, but dropping here in case it helps!
jmif
commented
1 year ago The PRs above have reduced the problem significantly but we're still seeing it from time to time. I did some more digging and I'm seeing this:
Workers to close: ('worker-9327e92731', 'worker-273d4b33ec', 'worker-e89203ed73')I0211 03:18:36.915510 2132 kuberuntime_container.go:709] "Killing container with a grace period" pod="namespace/worker-e89203ed73" podUID=xxx containerName="worker" containerID="containerd://xxx" gracePeriod=600Received signal SIGTERM (15) at 2023-02-11 14:18:36.926Connection to tcp://scheduler.namespace.svc.cluster.local:8786 has been closed. at 2023-02-11 14:18:36.930Failed to communicate with scheduler during heartbeat. at 2023-02-11 14:18:36.936Worker closed at 2023-02-11 14:18:36.938Remove worker <WorkerState 'tcp://10.4.7.236:41429', name:worker-e89203ed73, status: closing, memory: 919, processing: 2> at 2023-02-11 14:18:36.943Note the extremely quick succession of the final logs here and particularly the final log that says the worker has 919 items in memory. Could it be that this autoscaling process is not triggering a migration away or allowing the migration to happen? I found another instance that is nearly identical but the nanny logs out Worker process still alive after 6.399998626708985 seconds, killing.
If I've followed the code correctly the nanny is closing the worker with reason "nanny-close" which is the default reason so it seems to be coming from the terminate handler? I see a call to stop but the code in there is pretty generic so I'm not sure if the stop call actually results in keys being migrated away / work being preserved.
Finally, I traced through client side adaptive implementation you reference in your comment above and if I'm following correctly it eventually calls scale_down which internally calls scheduler.retire_workers, which I believe gracefully retires the workers.
jmif
commented
1 year ago Did a bit more digging and I see the retire_workers call in the scheduler. So I see that we're trying to gracefully close the workers before tearing down the pods. Looking at my logs I see:
(operator) 2023-02-11 14:18:36.000 Scaling worker group failed via the HTTP API, falling back to the Dask RPC
(operator) 2023-02-11 14:18:36.000 Workers to close X, Y, Z
(operator)  2023-02-11 14:18:36.000 Workers to close: ('common-crawl-phase-1-7105053484537348096-default-worker-9327e92731', 'common-crawl-phase-1-7105053484537348096-default-worker-273d4b33ec', 'common-crawl-phase-1-7105053484537348096-default-worker-e89203ed73')
(GKE Container X) 2023-02-11 14:18:36.000  Stopping container worker
(GKE Container Y) 2023-02-11 14:18:36.000  Stopping container worker
(GKE Container Z) 2023-02-11 14:18:36.000  Stopping container worker
(operator) 2023-02-11 14:18:36.000 Scaled worker group common-crawl-phase-1-7105053484537348096-default down to 12 workers.
(operator) 2023-02-11 14:18:36.000  Handler 'daskworkergroup_replica_update/spec.worker.replicas' succeeded.
These all happen instantaneously so it doesn't seem that we're allowing time to shut down (at least when we fall back to dask RPC). Note this is running #649 which is why the handler referenced is daskworkergroup_replica_update/spec.worker.replicas.
The scheduler is a node port service and I know this caused issues in one other place, perhaps that is the reason for falling back to RPC?
jmif
commented
1 year ago Looks like we're only calling workers_to_close in the fallback and not actually retiring them, testing a call to scheduler retire and will update here / include in PR if it resolves for us.
workers_to_close = await scheduler_comm.workers_to_close(
    n=n_workers,
    attribute="name",
)
await scheduler_comm.retire_workers(names=workers_to_close)
logger.info("Retired workers %s", workers_to_close)
return workers_to_closeConfirmed this fixes it for us! I also added some more logging and the HTTP call is failing due to a 404 (I'm running dask 2022.11.1). I've updated #649 with this fix as well.
tasansal
commented
1 year ago @jmif wow! Excellent debugging and progress. Once these are all merged, I would like to give the operator another try with our workflow and then close this issue.
jacobtomlinson
commented
1 year ago Closed by #649
Hi everyone! Thanks for all the effort on the Kubernetes operator for Dask. It is definitely the way to go. However, we ran into a problem that negatively affects our workload. The same minimally reproducible code runs fine with the classic
KubeClusterbut fails with the new one. The culprit seems to be theDaskAutoScaler. More details are below.We were able to reproduce this on a real cloud deployment on Google Cloud using the Kubernetes Engine, and using
minikubein a local developer deployment.Describe the issue
We are deploying the
Dask Kubernetes Operatoron our GKE cluster and turning on auto-scaling. However, with the simple example below, the auto scaler is having a very rough time. The pathology of issues we see:Preface: I will use
adapt_min, andadapt_maxto denote min/max values for the adaptive scaler.adapt_minworkers.adapt_max, sometimes it doesn't. Even with the same code.adapt_minandadapt_max, even if the workload takes more than 30 seconds. In the middle of the progress, it can kill workers and restart them.Key(...), but it wasn't available; reassigning.adapt_min.adapt_minor even to scale again.Minimal Complete Verifiable Example
Assuming
kubectlis set up, and the operator is installed. We follow the instructions to install the operator from here via Helm and it has the right permissions.Creating the Adaptive Dask Cluster and connect from Client via:
Workload; generate a random 3D array and take a slice from it. This mimicks our workload of reading a slice of a large
Zarrdataset:Here is a YouTube video I recorded. Creating cluster once and running the same workload multiple times: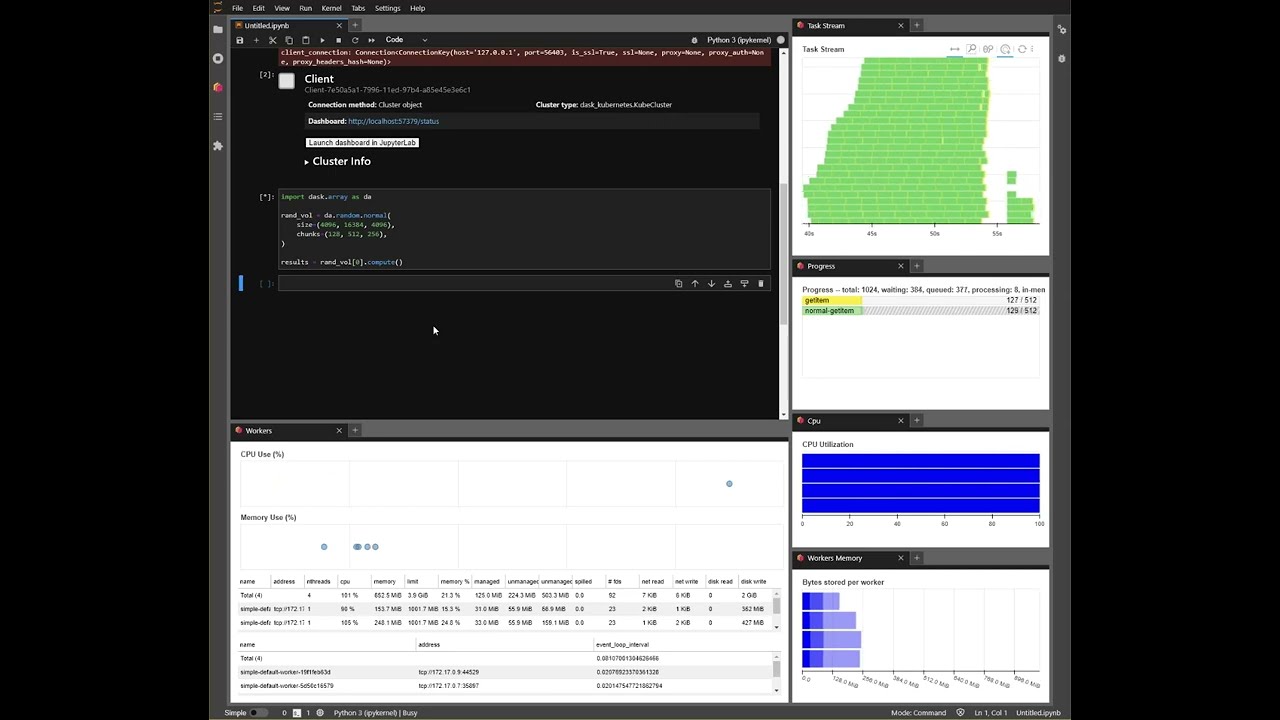
Run details below. Run 6 is the worst case. One level above that is we start getting key errors, which is reproducible with more workers easily.
Run 1: Never scales to 30 workers. Seems ok until the end, but then it scales down to 4 workers, rewinds the task graph, and runs some more jobs until it returns the data to the scheduler/client. Not sure what's happening here.
Run 2: Never scales above 19 workers. Same as run 1, it scales down to
adapt_minworkers and then reruns some. When we are done, we have 2 workers, which is 2 less thanadapt_min. We lost workers for some reason. It doesn't heal.Run 3: We scale up to
adapt_max! Which is good. But in the end, it scales down toadapt_minand runs more jobs. Then ALL workers die and we are left with 0 workers.Run 4: Executed while we have 0 workers. Then it scales up to 25 workers; and same issues happen as runs 1, 2, and 3. Again at the end we end up with 0 workers.
Run 5: We wait a little bit and some workers show up. Now it is 5; while we expect
adapt_minof 4. We execute it and now it scales up to 29 workers. One less thanadapt_max. Rewinds at the end and runs some more jobs. Back to 4 workers as expected.Run 6: Scales up to 8 workers, which is 22 less than
adapt_max. Stays there for a long time. Then it scales down (??) to 2 workers which is two less thanadapt_min. Loses work, rewinds the progress, then scales up to 16 workers. Then up to 23, then back down to 21. Then at the end, back to 4 workers, and runs more jobs, after all 512 were complete. Then we end up with 8 workers at idle; which is four more thanadapt_min.The same workload with the classic KubeCluster doesn't have any of these issues. Every single time, it scales up to 30 workers, runs it, then retires the workers. Back to 4. Creating classic
KubeCluster:Anything else we need to know?
kubectlworks as expected, even while a workload is running.cluster.yamlandautoscaler.yamlyields to same results.DaskAutoScaler, it keeps working fine. (withkubectl delete -f autoscaler.yaml)DaskAutoScaler, it starts happening again. (withkubectl apply -f autoscaler.yaml)GKEand locally withminikube. Same behavior.KubeClusterworks as expected. This issue doesn't happen.Made a discourse post before: https://dask.discourse.group/t/kubernetes-operator-autoscaler-losing-tasks-workers/1375
Environment