 david-barnett
commented
3 years ago
david-barnett
commented
3 years ago Hi Mary
I have updated the manuscript draft to clarify what it is that microViz does, regarding ordination creation and plotting, that is not readily available via phyloseq or microbiome. Thanks for prompting me to make these clarifications.
I have included the relevant excerpt from the updated manuscript at the bottom of this post, and tried to add some further context as responses for each of your points too.
Per point responses
-
Statement of need: microViz extends the set of distance measures (including e.g. Generalized UniFrac and Aitchison) of phyloseq and microbiome
- Question: phyloseq has 44 supported distance methods including UniFrac, what is provided that is not already included, and what additional uses do those distance measures provide?
- Response: In the manuscript (see end of this post) I have clarified the importance of the
inclusion of Generalised UniFrac and the Aitchison distance in microViz. Neither were
available directly through
phyloseq::distance().
-
Statement of need: microViz makes use of further ordination calculation and visualization methods more accessible, such as (distance-based) redundancy analysis (RDA) and canonical correspondence analysis (CCA)
- Question: the microbiome R package has options for RDA and CCA, what additional functionality does microViz provide?
- Response: the
phyloseq::ordinate()function does offer RDA and CCA (by wrapping methods mostly from vegan), which the user can specify via a formula.microViz::ord_calc()uses thisphyloseq::ordinate()function internally, and records the chosen method and constraints, for provenance tracking of the final plot.
-
Statement of need: microViz generates bi-plots and tri-plots with the ggplot2 R package
-
Question: the other standard microbiome packages generate bi-plots, what additional functionality does microViz provide?
-
Response:
-
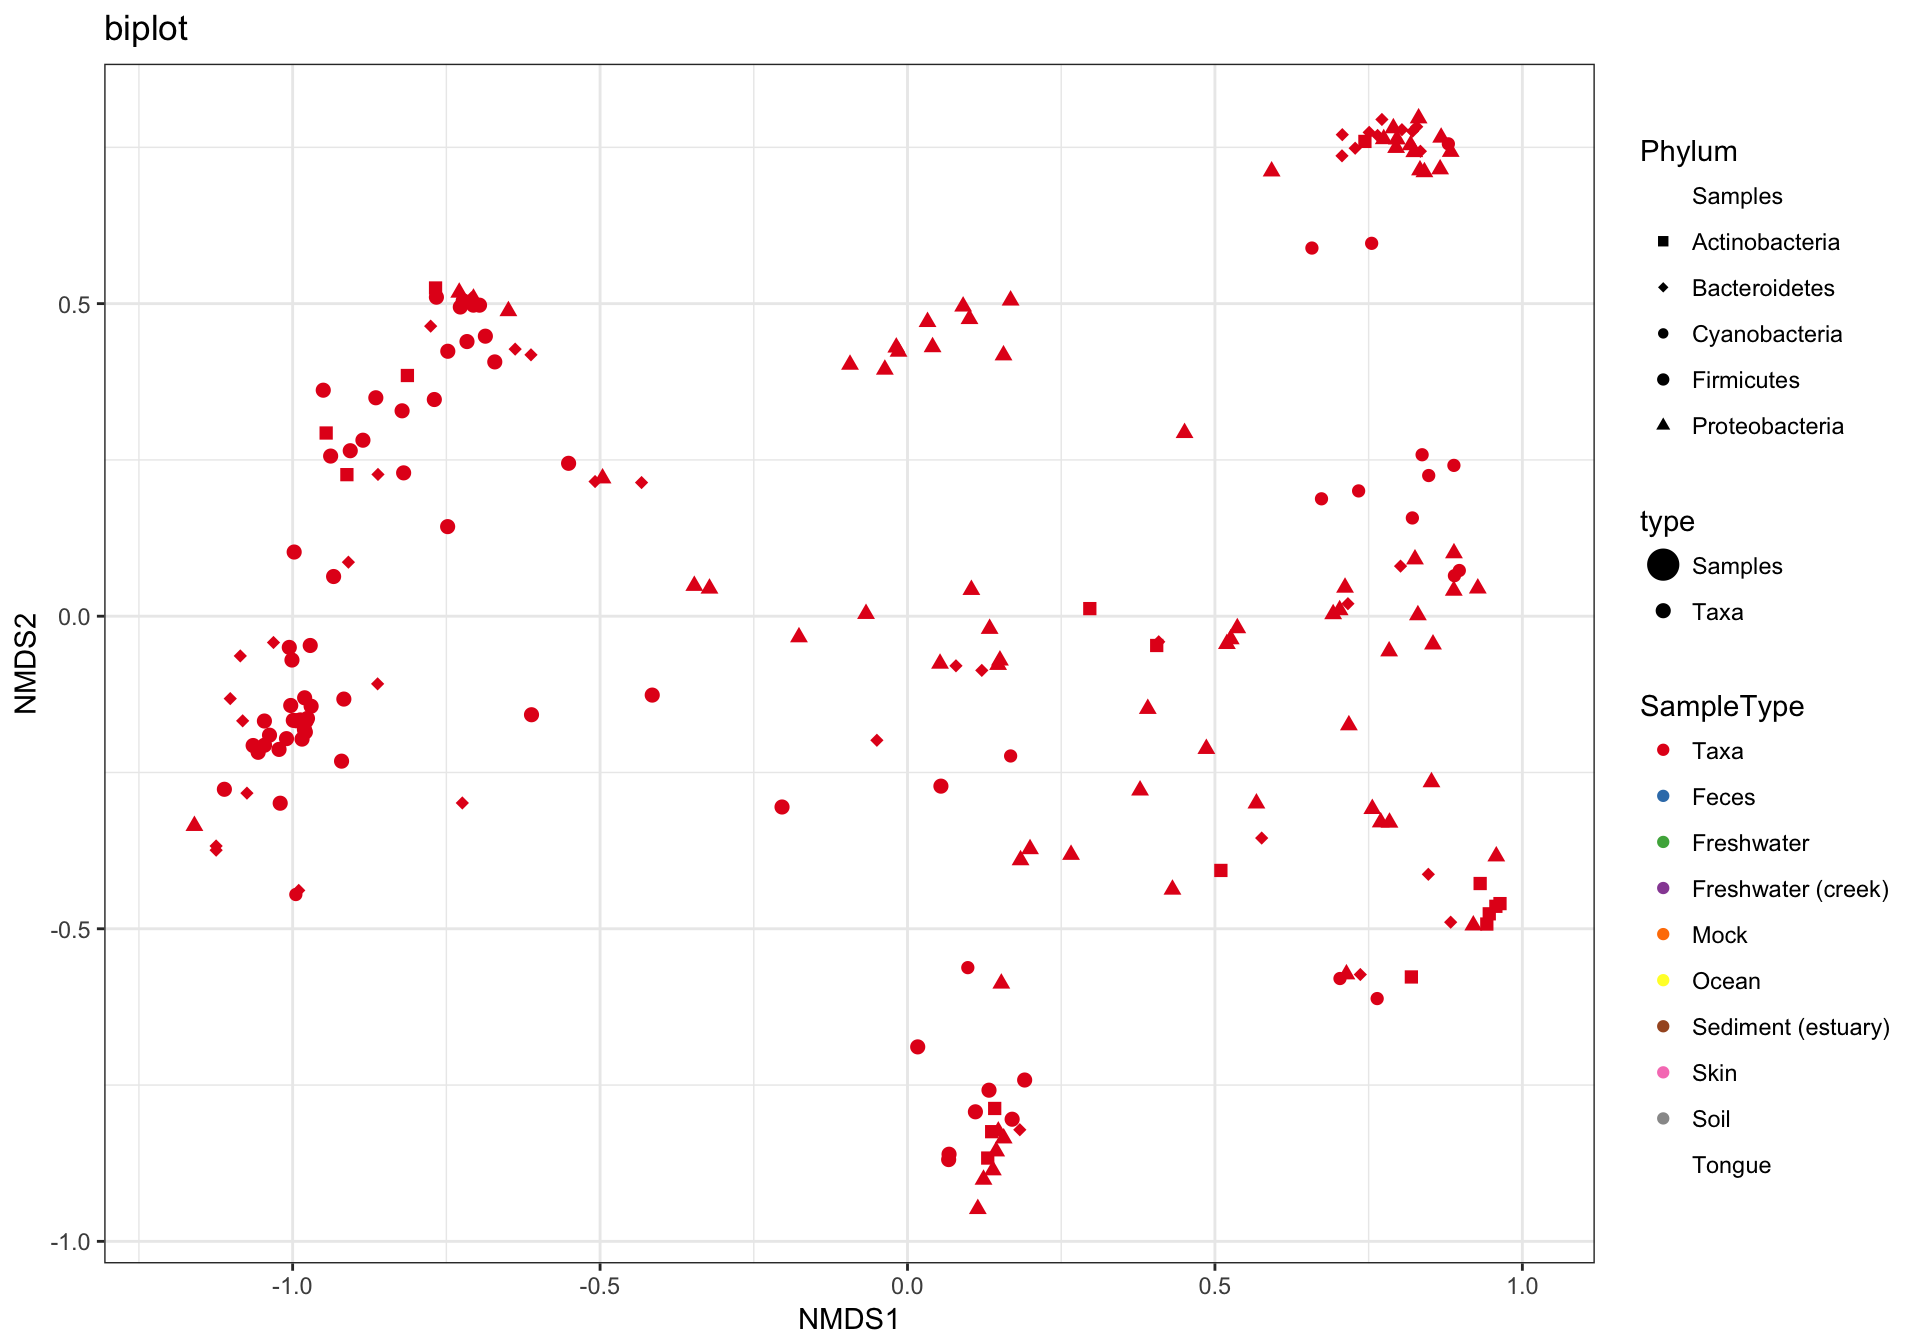
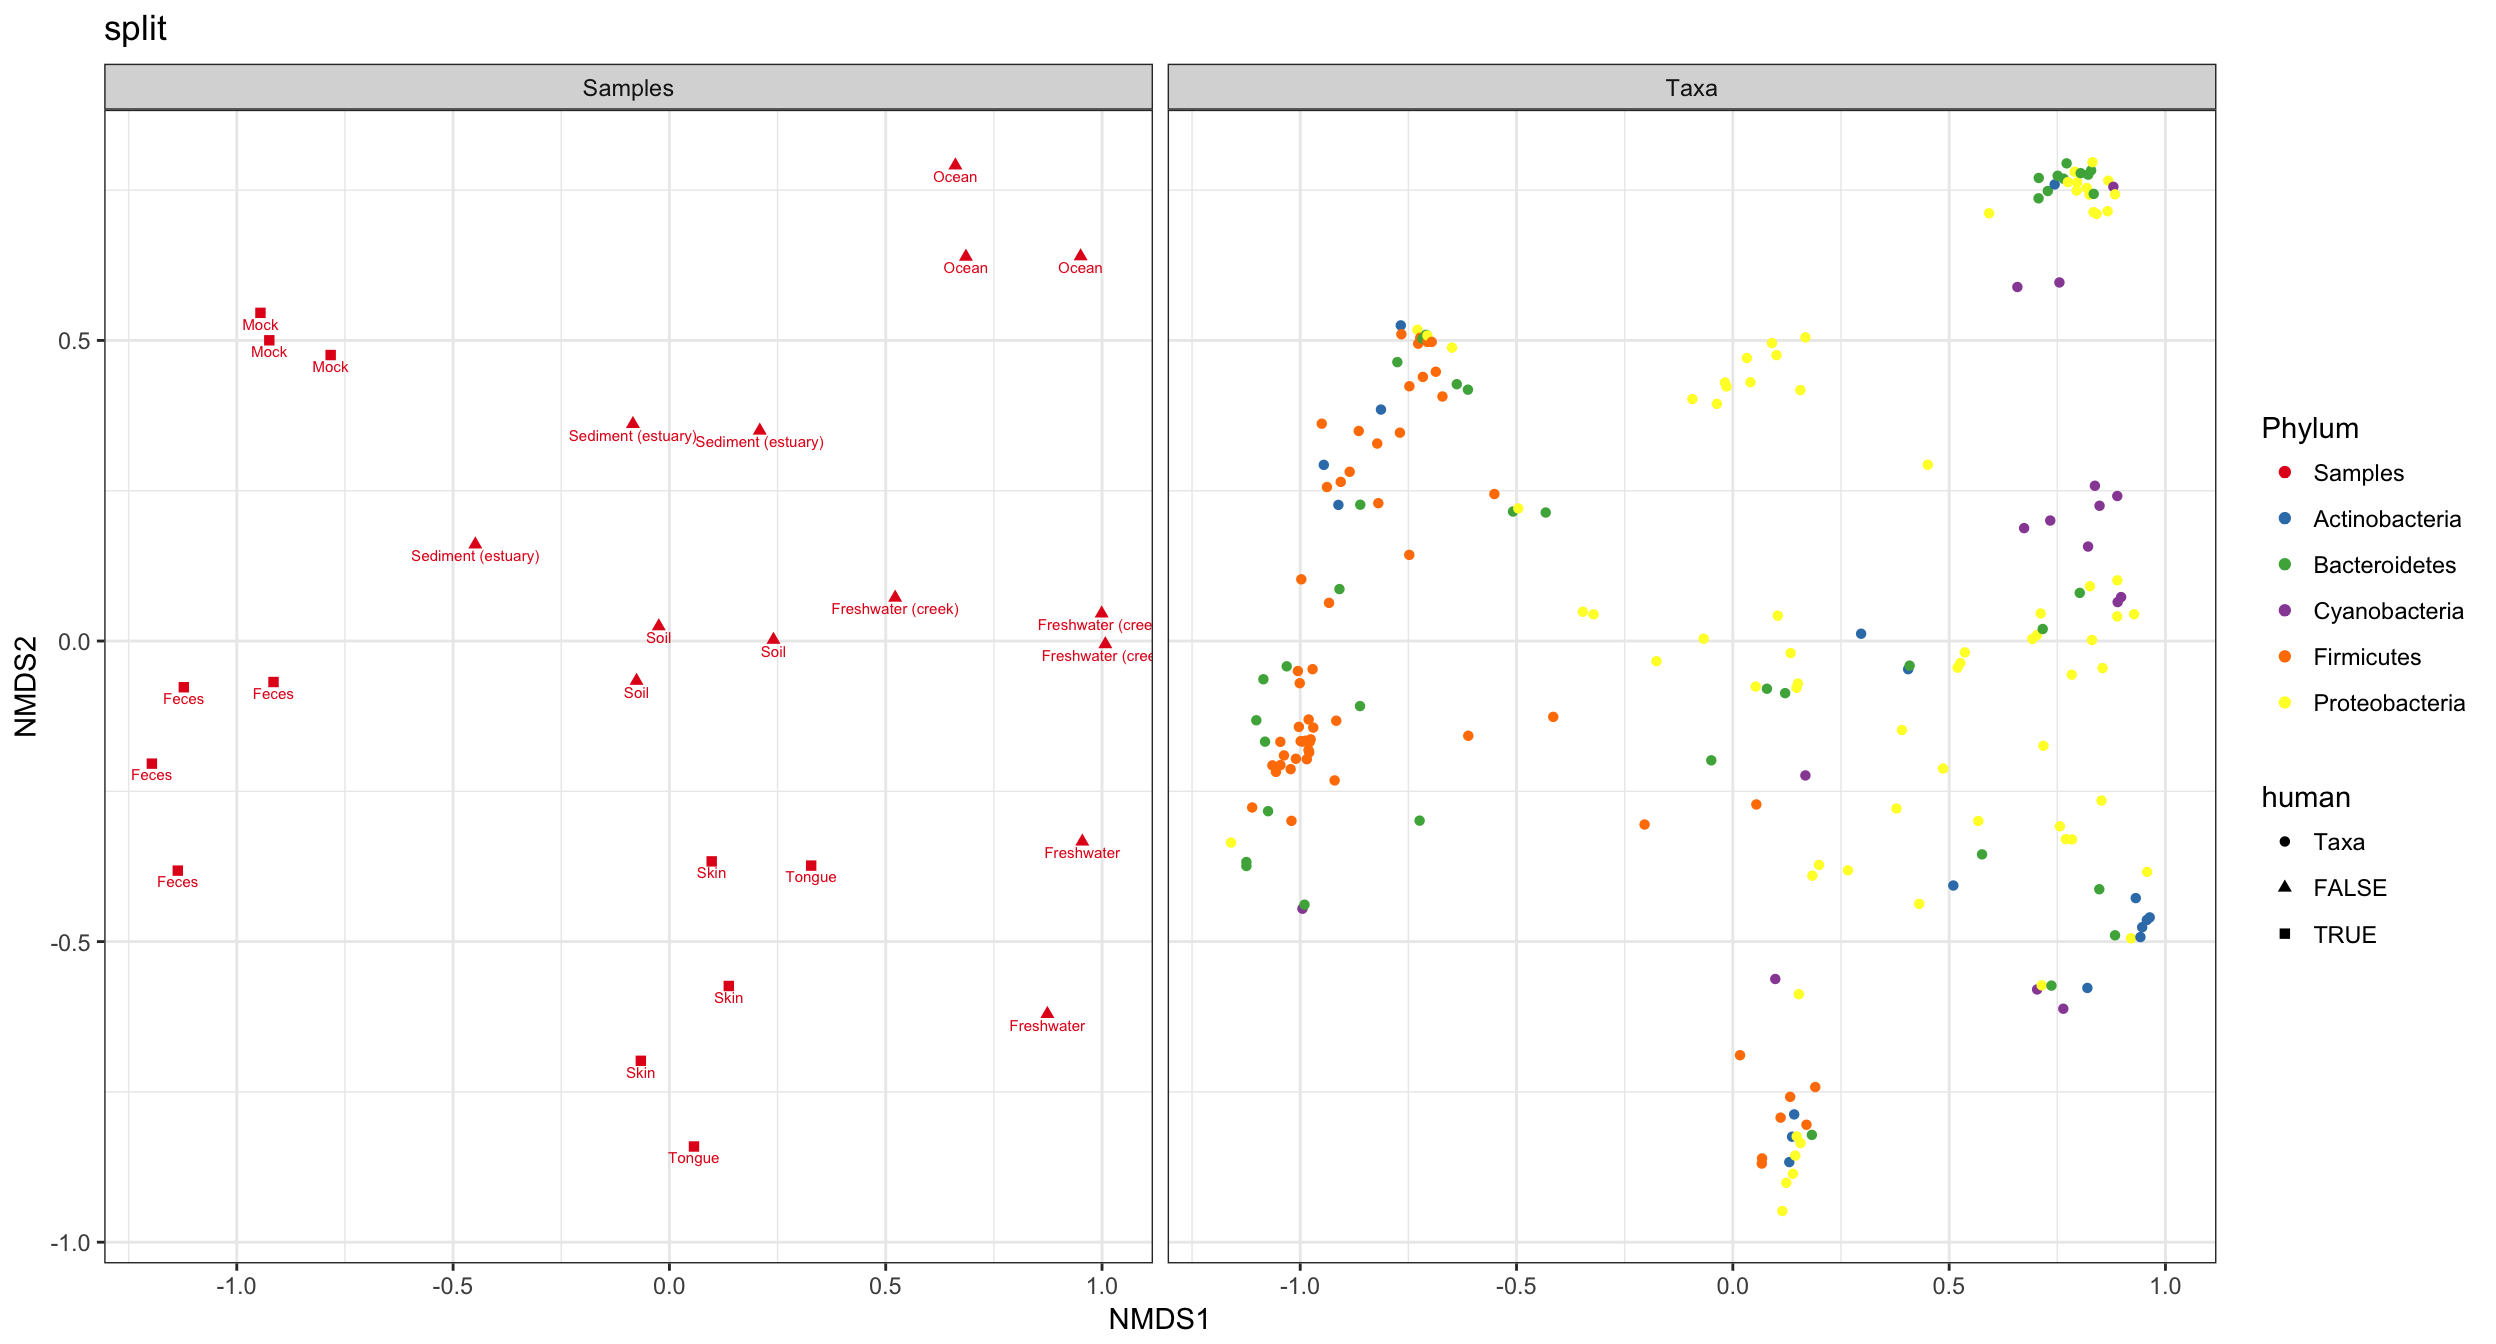
phyloseq::plot_ordination()supports plotting both samples and taxa loadings as bi-plots and split plots. However neither phyloseq or microbiome provide methods for plotting constraints, as far as I can tell, and neither directly support representing loadings or constraints as labelled arrows. This is the style microViz offers, which I think offers easier interpretation and flexibility. It is somewhat similar to the ordination plot style used by the commercial software Canoco. Examples below are from the phyloseq documentation website and the microbiome package's tutorial website. -
vegan provides the most flexible ordination plotting approach, but this is with base R graphics, and arguably more challenging for R novices to use and customise. You can see some PDF-embedded vegan examples at this link. https://cran.r-project.org/web/packages/vegan/vignettes/intro-vegan.pdf
-
Below is an example of an RDA tri-plot created with microViz, the code for which is now part of the microViz website's ordination vignette https://david-barnett.github.io/microViz/articles/ordination.html#customising-your-ordination-plot-1

-
-

Updated manuscript excerpt
Ordination methods like Principle Coordinates/Components Analyses (PCoA/PCA) are a staple method in microbiome research. The vegan R package implements the majority of distance and ordination calculation methods and microViz makes available two further dissimilarity measures: Generalized UniFrac from the GUniFrac package, and the Aitchison distance. The former provides a balanced intermediate between unweighted and weighted UniFrac [chen_2012], and the latter is a distance measure designed for use with compositional data, such as sequencing read counts [gloor_2017].
The phyloseq R package provides an interface for producing ordination plots, with the ggplot2 R package. microViz streamlines the computation and presentation of ordination methods including the constrained analyses: redundancy analysis (RDA), distance-based RDA, partial RDA, and canonical correspondence analysis (CCA). microViz can generate highly customizable ggplot2 bi-plots and tri-plots, showing labelled arrows for microbial loadings and constraint variables when applicable. Furthermore, these figures are captioned automatically, by default. The captions are intended to promote better reporting of ordination methods in published research, where too often insufficient information is given to reproduce the ordination plot. To provide the automated captioning, microViz implements a simple S3 list class, ps_extra, for provenance tracking, by storing distance matrices and ordination objects alongside the phyloseq object they were created from, as well as relevant taxonomic aggregation and transformation information.
Moreover, microViz provides a Shiny app interface that allows the user to interactively create and explore ordination plots directly from phyloseq objects. The Shiny app generates code that can be copy-pasted into a script to reproduce the interactively designed ordination plot. The user can click and drag on the interactive ordination plot to select samples and directly examine their taxonomic compositions on a customizable stacked bar chart with a clear colour scheme.
Hi David,
Upon reading through your statement of need, I had some questions. I went by each statement to examine the novelty added by your tool, and maybe you can comment on these: