I am trying to achieve the same thing (https://stackoverflow.com/questions/69780665/ggplot-sankey-diagram-of-income-to-expenses-ggsankey). Curious if there is a clean way to incorporate it.
Open MPietzke opened 3 years ago
I am trying to achieve the same thing (https://stackoverflow.com/questions/69780665/ggplot-sankey-diagram-of-income-to-expenses-ggsankey). Curious if there is a clean way to incorporate it.
I think the optimal data format for this use case would be

Categories are created from the top to bottom, with categories matched to previously created ones. The only limitation is that you can't have categories at different stages with the same name, which I think is a very limited edge case and bad design.
I wrote this function to convert this type of sankey data into something that ggsankey can plot.
the function requires data to be in this format
sankey_data_input <-tibble::tribble(
                 ~node,        ~next_node,  ~value,
    "Moira's Earnings",          "Budget",  50000L,
   "Johnny's Earnings",          "Budget", 300000L,
              "Budget", "Living Expenses", 140000L,
              "Budget",   "Spent Savings",  25238L,
              "Budget",     "Liabilities",  44280L,
              "Budget", "Planned Savings",  23000L,
              "Budget",           "Taxes",  98482L,
              "Budget",       "Insurance",  13000L,
  )
make_data_sankey <- function(data) {
"%nin%" <- Negate('%in%')
data$x <- NA
for (i in 1:length(data$node)) {
if (data$node[i] %nin% data$next_node) {
data$x[i] <- 1
}
}
for (i in 1:length(data$node)) {
if (data$node[i] %in% data$next_node) {
data$x[i] <- data$x[match(data$node[i], data$next_node)] +1
}
}
sankey_data2 <- data %>%
mutate(
next_x = x + 1
) %>% group_by(x, node) %>%
mutate(total = sum(value)) %>%
ungroup()
final_nodes <- sankey_data2 %>%
dplyr::filter(next_x == max(next_x))
final_rows <- tibble(
node = final_nodes$next_node,
value = final_nodes$value,
total = final_nodes$value,
x = final_nodes$next_x,
next_node = NA,
next_x = NA
)
bind_rows(sankey_data2, final_rows)
}Great! I was also thinking of improving the "make_long" function or considering an "add_node" function but didn't find the time yet. However, there is a problem with the calculation of the totals (I think not really needed but added by me for better illustration and understanding). With slightly different data (combining flows from 2 sources), e.g.:
sankey_data_input <-tibble::tribble(
  ~node,        ~next_node,  ~value,
  "Moira's Earnings",          "Budget",  44000L,
  "Johnny's Earnings",          "Budget", 200000L,
  "Johnny's Earnings",          "Johnny's own", 100000L,
  "Johnny's own",   "Taxes",    32827L ,
  "Johnny's own",   "Living Expenses",    60000L ,
  #"Johnny's own",   "Johnny's Savings",    10000L ,
  "Budget", "Living Expenses", 100000L,
  "Budget",   "Spent Savings",  25238L,
  "Budget",     "Liabilities",  44280L,
  "Budget", "Planned Savings",  23000L,
  "Budget",           "Taxes",  65655L,
  "Budget",       "Insurance",  13000L,
)
it looks like this:

However when the total is calculated after all steps are combined it's working better:
make_data_sankey_new <- function(data) {
  "%nin%" <- Negate('%in%')

  data$x <- NA

  for (i in 1:length(data$node)) {
    if (data$node[i] %nin% data$next_node) {
      data$x[i] <- 1
    }
  }

  for (i in 1:length(data$node)) {
    if (data$node[i] %in% data$next_node) {
      data$x[i] <- data$x[match(data$node[i], data$next_node)] +1
    }
  }

  sankey_data2 <- data %>%
    mutate(next_x = x + 1)
      # %>%  group_by(x, node) %>%
      # mutate(total = sum(value)) %>%
      # ungroup()

  final_nodes <- sankey_data2 %>%
    dplyr::filter(next_x == max(next_x))

  final_rows <- tibble(
    node = final_nodes$next_node,
    value = final_nodes$value,
    total = final_nodes$value,
    x = final_nodes$next_x,
    next_node = NA,
    next_x = NA
  )

  bind_rows(sankey_data2, final_rows)  %>%
    group_by(x, node) %>%
    mutate(total = sum(value)) # total is calculated here!
}
Just contributing my version of the same function, which also works for unbalanced cases where the totals in each stage are not the same. (In other words: where flows stop at different stages.) The previous version would only expect final nodes to be in the final stage.
make_data_sankey_new <- function(data) {
  "%nin%" <- Negate('%in%')

  data$x <- NA

  for (i in 1:length(data$node)) {
    if (data$node[i] %nin% data$next_node) {
      data$x[i] <- 1
    }
  }

  for (i in 1:length(data$node)) {
    if (data$node[i] %in% data$next_node) {
      data$x[i] <- data$x[match(data$node[i], data$next_node)] +1
    }
  }

  sankey_data2 <- data %>%
    mutate(next_x = x + 1)

  final_nodes <- sankey_data2 %>%
    dplyr::filter(next_node %nin% node) # last nodes regardless of stage

  final_rows <- tibble(
    node = final_nodes$next_node,
    value = final_nodes$value,
    total = final_nodes$value,
    x = final_nodes$next_x,
    next_node = NA,
    next_x = NA
  )

  bind_rows(sankey_data2, final_rows)  %>%
    group_by(x, node) %>%
    mutate(total = sum(value))
}
The question is based on this issue: https://github.com/davidsjoberg/ggsankey/issues/6
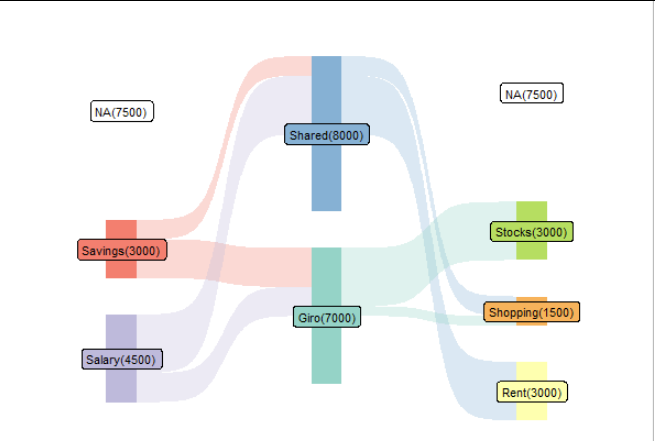
First of all, it would be nice to have a proper explanation how the structure of the data should look like. I'm planning to visualise my finances, with 3 stages. I noticed this isn't working, although this is (at least for me) the more logical input structure, you define the flows from stage 1 to stage 2, and these from stage 2 to stage 3. It isn't necessarily defined from stage 1 to 3.
 The empty fields generate NA's which create new nodes, when being converted to long and plotted.

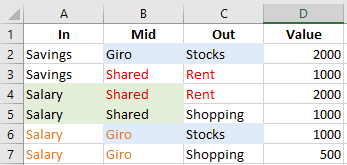
It works however when all the combinations are filled and the numbers (the money) are distributed:
Notice that we now have some duplications in here, e.g. the salary that goes into the giro (1500) is splitted into the money that goes from the giro to the stocks and the shopping. (1000 + 500). Also the money comes from the giro and ends in the stocks (3000) is splitted into the source savings (2000) and salary (1000)
When converting to long and removing the nodes that are NA and the next_nodes that are NA (except for the last nodes) this seem to work. At least for the 3 stages. Maybe you can further test and incorporate this!
CODE: