It's a good idea, I'll think of something. Thx.
Closed ashirwad closed 5 years ago
It's a good idea, I'll think of something. Thx.
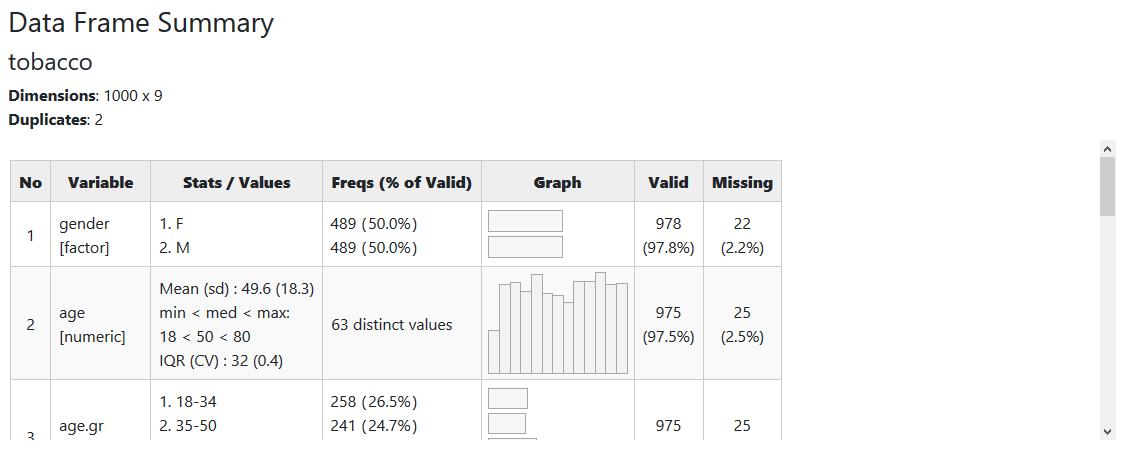
I've added a new argument max.tbl.height to the print() method and view() function. What it does is wrap the table inside a scrollable div having the specified height in pixels.
Note that it can only be used for html-type tables (i.e. method = "render", "viewer" or "browser").
For pander tables, I tried but it really messed up the layout in Notebooks, not too sure why.
devtools::install_github("dcomtois/summarytools")
devtools::install_github("rapporter/pander")
Then, in the Notebook:
```{r, echo=FALSE, results='asis'}
library(summarytools)

# Add summarytools css
st_css(bootstrap=FALSE)
print(dfSummary(tobacco), max.tbl.height = 300, method = "browser", footnote = NA)
Thanks for being so prompt! I tested it and it's working the way I had expected, except for one thing: now the summary table is not contained inside the page width of the notebook. Any idea on how I might fix this?

Right. You'll need to include the summarytools css as well. I'll update my example above.
You are AWESOME! It works like a charm now!
One quick follow-up comment. The dfSummary() function is producing a blank panel along with the summary output. This adds unnecessary blank space between the summary output and the next section! Any idea why this is happening?
Thanks again for responding to my questions! You have done an excellent job with this package!


I can't reproduce it... Can you pls post a small reproducible example? Thx!
Here is an example:
I see... The gap is actually a blank image, probably inserted by knitr b/c you used df_print: paged.
I played with the different options that I can use with df_print, but the problem persists! If you come across a solution, please do let me know!
Another interesting observation: when I run the code print(dfSummary(tobacco)) in the console, I don't get any error message; however, when I run the same code within the R Markdown document (using the green triangle), I am getting this error: NAs introduced by coercion I am not sure why I am seeing different behaviors of the same function call!
I also noticed the NAs introduced by coercion in your output, but cannot reproduce it (nor can I reproduce the gap caused by image... What OS do you use? Do you use RStudio's "knit to html" to render the results? What happens if you create an Rmd document instead of a R notebook?
At this point I'd try removing packages knitr, markdown, rmarkdown, pander & summarytools, and re-installing them, (the last two from github, the others either from CRAN or github).
a) I use windows. b) No, I use the Preview button in RStudio. (c) Actually, R Notebook uses Rmd in the background. So, anytime you create a notebook file, RStudio creates two files for you: one with the .Rmd extension and the other with .nb.html. So, this problem persists even when I create a .Rmd file! At this point, I will follow your recommendation and will let you know if I had any success!
Hi Dcomtois,
I do find the the scrolling bar really handy but may I provide further suggestion for the dfsummary.print on HTML?
I am not sure if you have used the DT package. What that package does is to transform R object to data table where you can interactively selected the no of rows/page number you want to display on the HTML. Also, they have filtering, searching and sorting features.
should be quite easily to implement for your dfsummary function except for the histogram column.
see here: https://rstudio.github.io/DT/
outputs can be passed to DT directly... But DT doesn't seem to support multiline cells.
```{r, echo=FALSE, results='asis'}
library(summarytools)
st_css()
library(DT)
datatable(dfSummary(tobacco, graph.col = FALSE))Thanks for your prompt reply Dcomtois!
I just found out that someone has asked this question for DT library. The way to work around is to replace the separators by < br/ > (without spaces in between) in the dataframe object and set the argument escape = FALSE in the datatable function.
I havent tried it yet but the link for the question is here https://stackoverflow.com/questions/47941592/multiple-lines-observation-in-dt
A further update - the DT suggestions on how to do multiple lines
https://github.com/rstudio/DT/issues/635#issuecomment-463184653
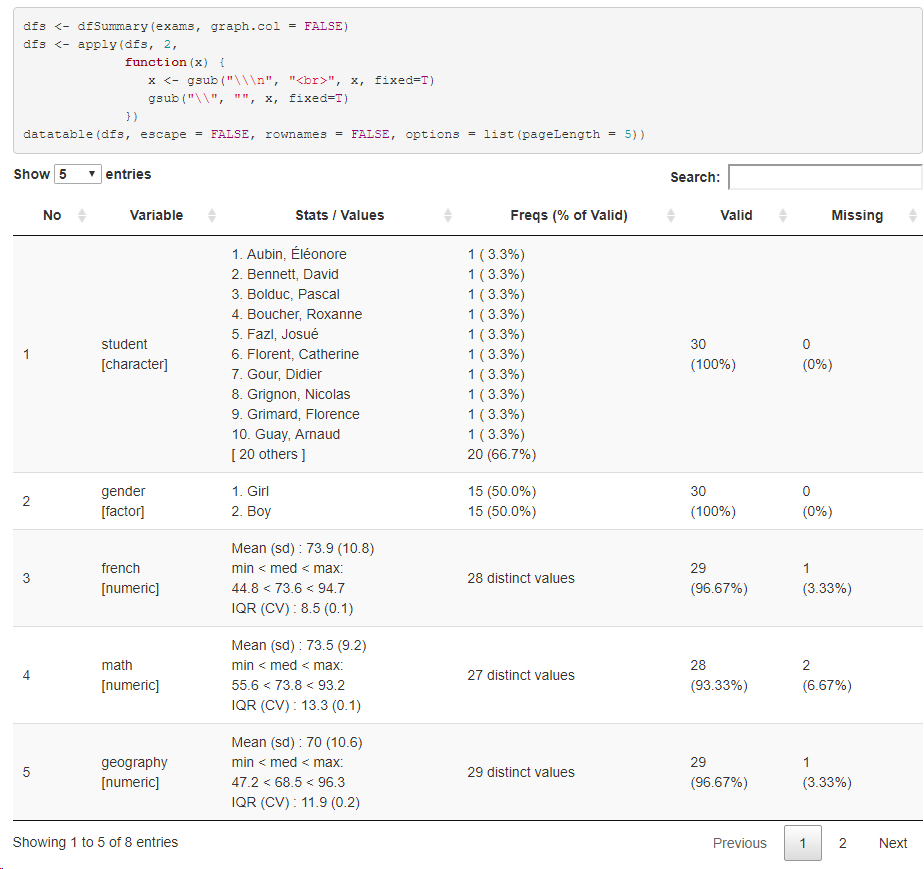
Ok, I'm not sure about including it as additional functionality (need to think about it), but here's a workable example in the meantime:
```{r, echo=FALSE, results='asis'}
library(summarytools)
library(DT)

# Add summarytools css
st_css()
dfs <- dfSummary(exams, graph.col = FALSE)
datatable(apply(dfs, 2, function(x) {
x <- gsub("\\\n", "<br>", x, fixed=T)
gsub("\\", "", x, fixed=T)}),
escape = FALSE, rownames = FALSE, options = list(pageLength = 5))
A big thanks.
I also agree that adding DT in might not add that much value to the current package just make it more fancy.
Anyway you have created an extremely useful tool! Many thanks for making the package and replying me quickly!
You're welcome @waiyujack :)
Hi all.
I faced problem with diplaying table in flexdashboard in R. 'Stats/Values' column is not row based. I want to get table like my viewer's table (second pic)


Displaying the data summary using
dfSummary()function occupies a lot of space in R Notebook when there are many variables, say 100. It would be nice if there was an option to present the results within a vertical scrollbar. This will prevent the notebook from becoming lengthy and facilitate easier navigation of the output summary.