Testing has shown that slope correction derived from transmission measurements does not negatively impact reflection measurements. As such, it should probably be retained for both unless a reason not to is discovered. Also, testing has shown that slope corrections across multiple units are very close, despite differences in LED brightness levels. Therefore, it is likely that this tedious process can be done on a per-batch, rather than a per-unit, basis.
Note: This can be considered part of the calibration process. In fact, if done well, it could be used entirely in lieu of the densitometer's traditional low/high point calibration routines. However, in practice, it is too involved to be done via the local on-device UI and is best left as part of the "factory calibration" process.
The Problem
As light levels decrease, the TSL2591 light sensor tends to undercount detected light. With reflection measurements, enough light is still received with the CAL-HI target that this hasn't been much of a problem. With transmission measurements, however, the CAL-HI target is dim enough that this issue begins to show itself.
When doing normal calibration, with the CAL-HI point being undercounted, the errors in the resulting measurements tend to follow a bit of a curve. Readings in the middle of the scale are further off than either end. Picking a lower-density CAL-HI target won't help, because then readings at the dense end of the scale will be off even more.
What makes this whole situation more difficult, is that density is measured on a logarithmic scale. Therefore, even apparently small errors in raw sensor data on the dense end tend to get magnified to the point of causing noticeable errors in the resulting density readings.
The Analysis
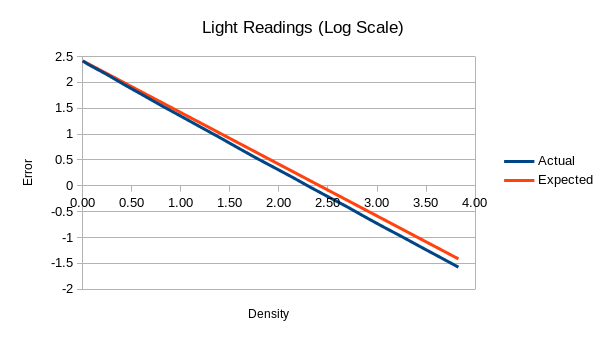
An analysis of sensor readings was conducted, using a calibrated step wedge, to compare actual vs expected readings from full-brightness all the way down to 3.83D (~0.01%) It was determined that, while these two values look close on a linear scale, if you take the logarithm of each one and compare that, a divergence is clear:
While this divergence might appear linear at first glance, it is not. A graph specifically showing just this divergence appears to actually have its own curve: This curve kinda looks like it could be estimated with a second-order polynomial.
The Solution
From a calibrated step wedge, build a table of actual to expected light readings. These readings will be in the unit known as "basic counts" (sensor data made independent of gain/integration settings). This table will range from max brightness (sensor reading with nothing in its path) all the way through each patch of the step wedge up to the max.
For each patch, the expected light reading can be calculated by "Lexp = Lmax / (10^D)" where D is the density of the step wedge at that patch.
Then construct a set of two arrays. The X array consists of the log10 of each actual light reading, while the Y array consists of the log10 of each expected light reading. (the first entry in each array, Lmax, should have the same value)
Perform a second order polynomial regression on these arrays, which will yield 3 constants. These constants shall be known as P0, P1, and P2, and are the result of the slope calibration.
To implement a correction based on the slope calibration on-device, use some form of the following code:
The corrected measurement, still in "basic count" units, can then be used for all subsequent processing with no changes elsewhere.
Conclusion
The proposed solution is too involved to be practical to implement on-device. The most feasible approach is likely going to be doing it off-line (perhaps inside desktop software) and then loading the resulting calibration numbers into the device. It is as of yet unclear whether this process will need to be done for every single unit, or if it can be done on a coarser "batch" basis with individual units only needing the simpler 2-point calibration on top of it.
However, this hassle is well worth it. In preliminary testing, it gets the density error down to +/- 0.01D across the full range. (Obviously results this good are not expected to hold across the full range of test materials and conditions, but starting here in an idealized test scenario dramatically improves our changes of sticking close enough beyond it.)