 zeroby0
commented
4 years ago
zeroby0
commented
4 years ago Hi! Can you zoom in the spectrogram to the center frequency? Currently it's multiple MHz wide, so the actual signal is just a thin line.
Closed dernasherbrezon closed 6 years ago
zeroby0
commented
4 years ago Hi! Can you zoom in the spectrogram to the center frequency? Currently it's multiple MHz wide, so the actual signal is just a thin line.
 dernasherbrezon
commented
4 years ago
dernasherbrezon
commented
4 years ago Do you have an example? Currently it is 240khz or 288khz wide. And you can't "zoom" because FFT was created once and all buckets are pixels. So if you want to zoom into the part of the spectrogram, you have to define smaller FFT bucket and run FFT on the original data.
zeroby0
commented
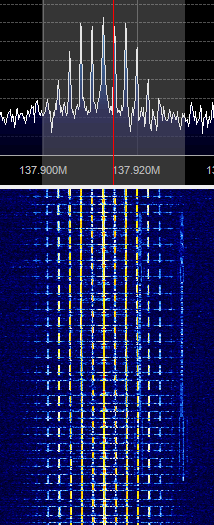
4 years ago Here is a spectrogram for a NOAA 18 pass.
I thought the thin line in the center is the NOAA transmission, but if the current width is 240Khz, then the 40KHz NOAA signal is too thin to be the thin center line. If the width is 240Khz, then there is no need to zoom in more.
But isn't this spectrogram too symmetric? That's a bit suspicious, do you know what's going on here?

dernasherbrezon
commented
4 years ago Hey, couple of things:
zeroby0
commented
3 years ago If they are symmetric, can we drop one half so we can have a better use of space? Maybe also a smaller spectral width for NOAA satellites so we can see it better?
Will help with debugging