Closed dhimmel closed 9 years ago
In 3007ac01d7cc4a753c277a4fd5a46771f58b5ce0, we confirm that HH550 SNP abundances for genes in chromosomes 1-22 did not change. We confirm their consistency.
For chrX, 89% of genes had at least one SNP on HH550 in the revised dataset. For chrY, only 20% of genes had at least one SNP.
I find it unlikely that changes to a small number of genes could have such a drastic effect.
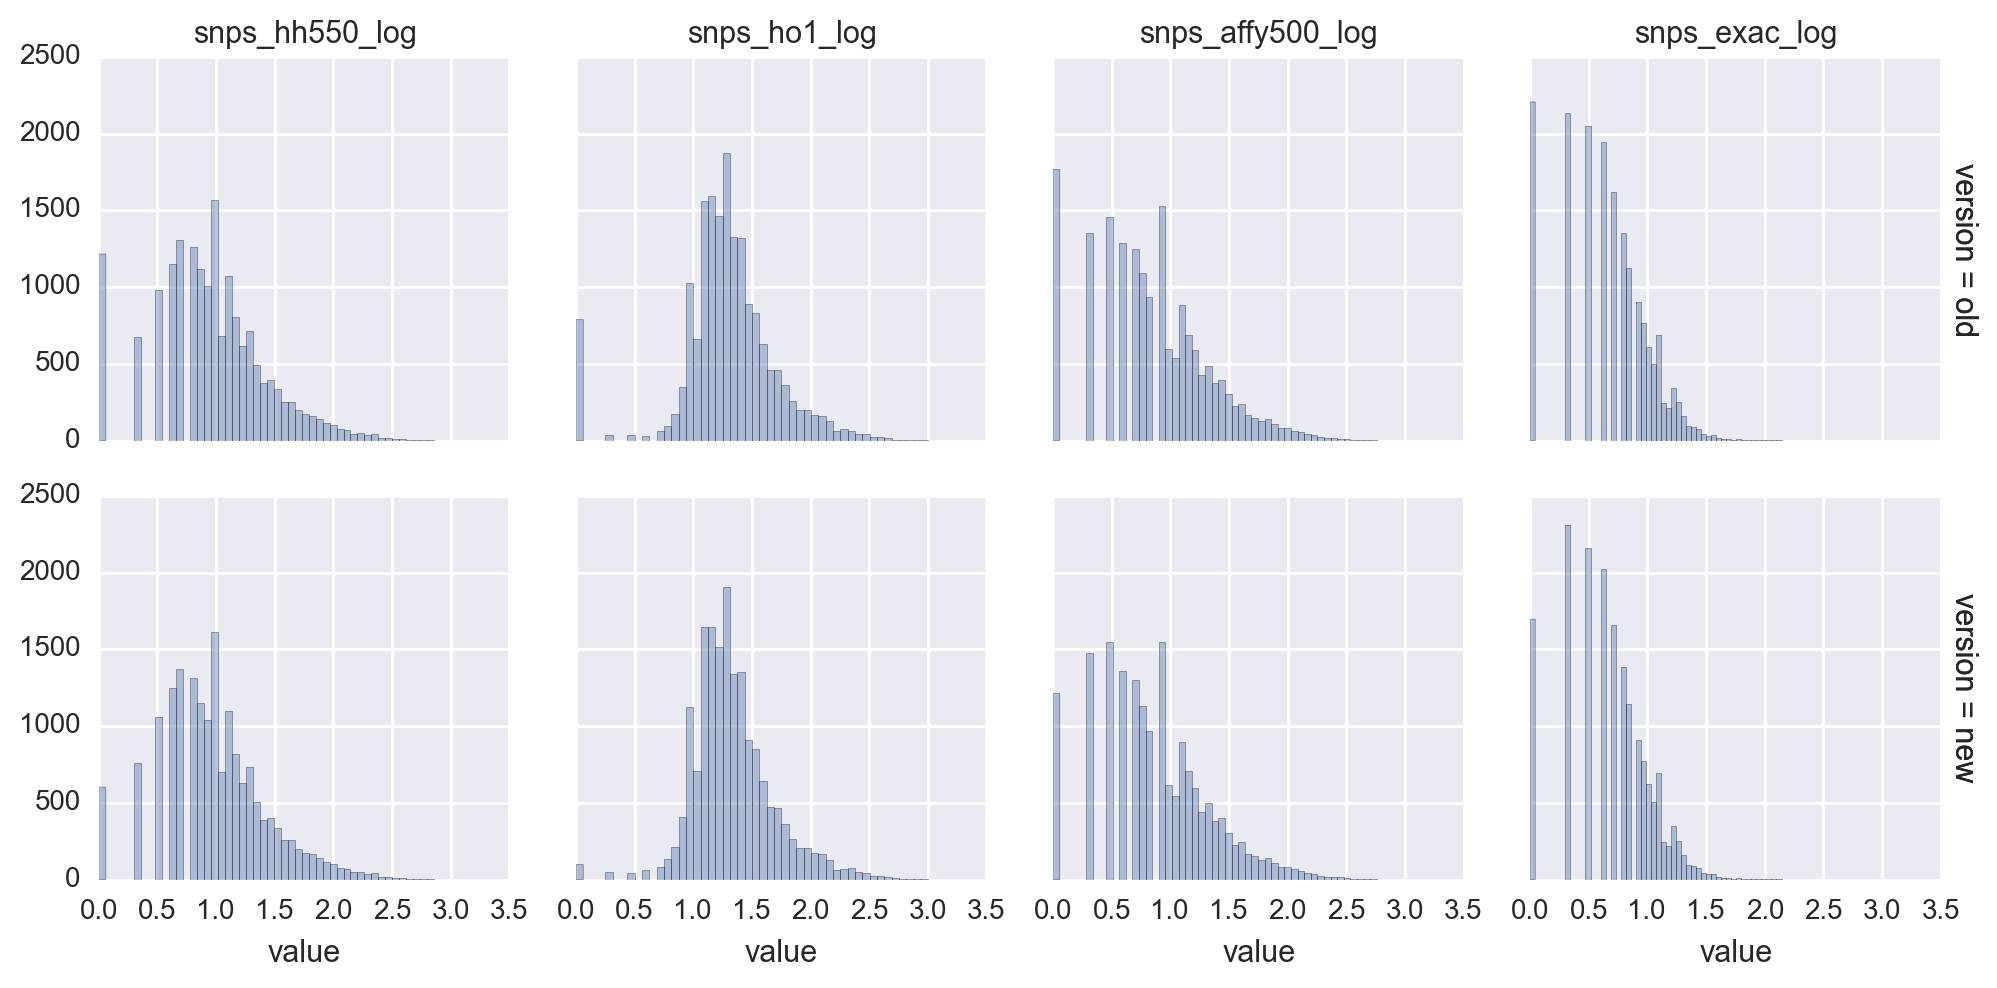
As expected, fixing the chrX and chrY bug led to fewer genes with 0 SNPs (notebook). This affected all platforms, so it is unclear why only HH550 would experience drastic change.
For reference, chrX contains 692 genes and chrY contains 20.
We recreated the plots from the first post in python using seaborn. First, however we had to diagnose and fix a seaborn bug (https://github.com/mwaskom/seaborn/pull/686) which was drawing scatterplots in addition to curves.
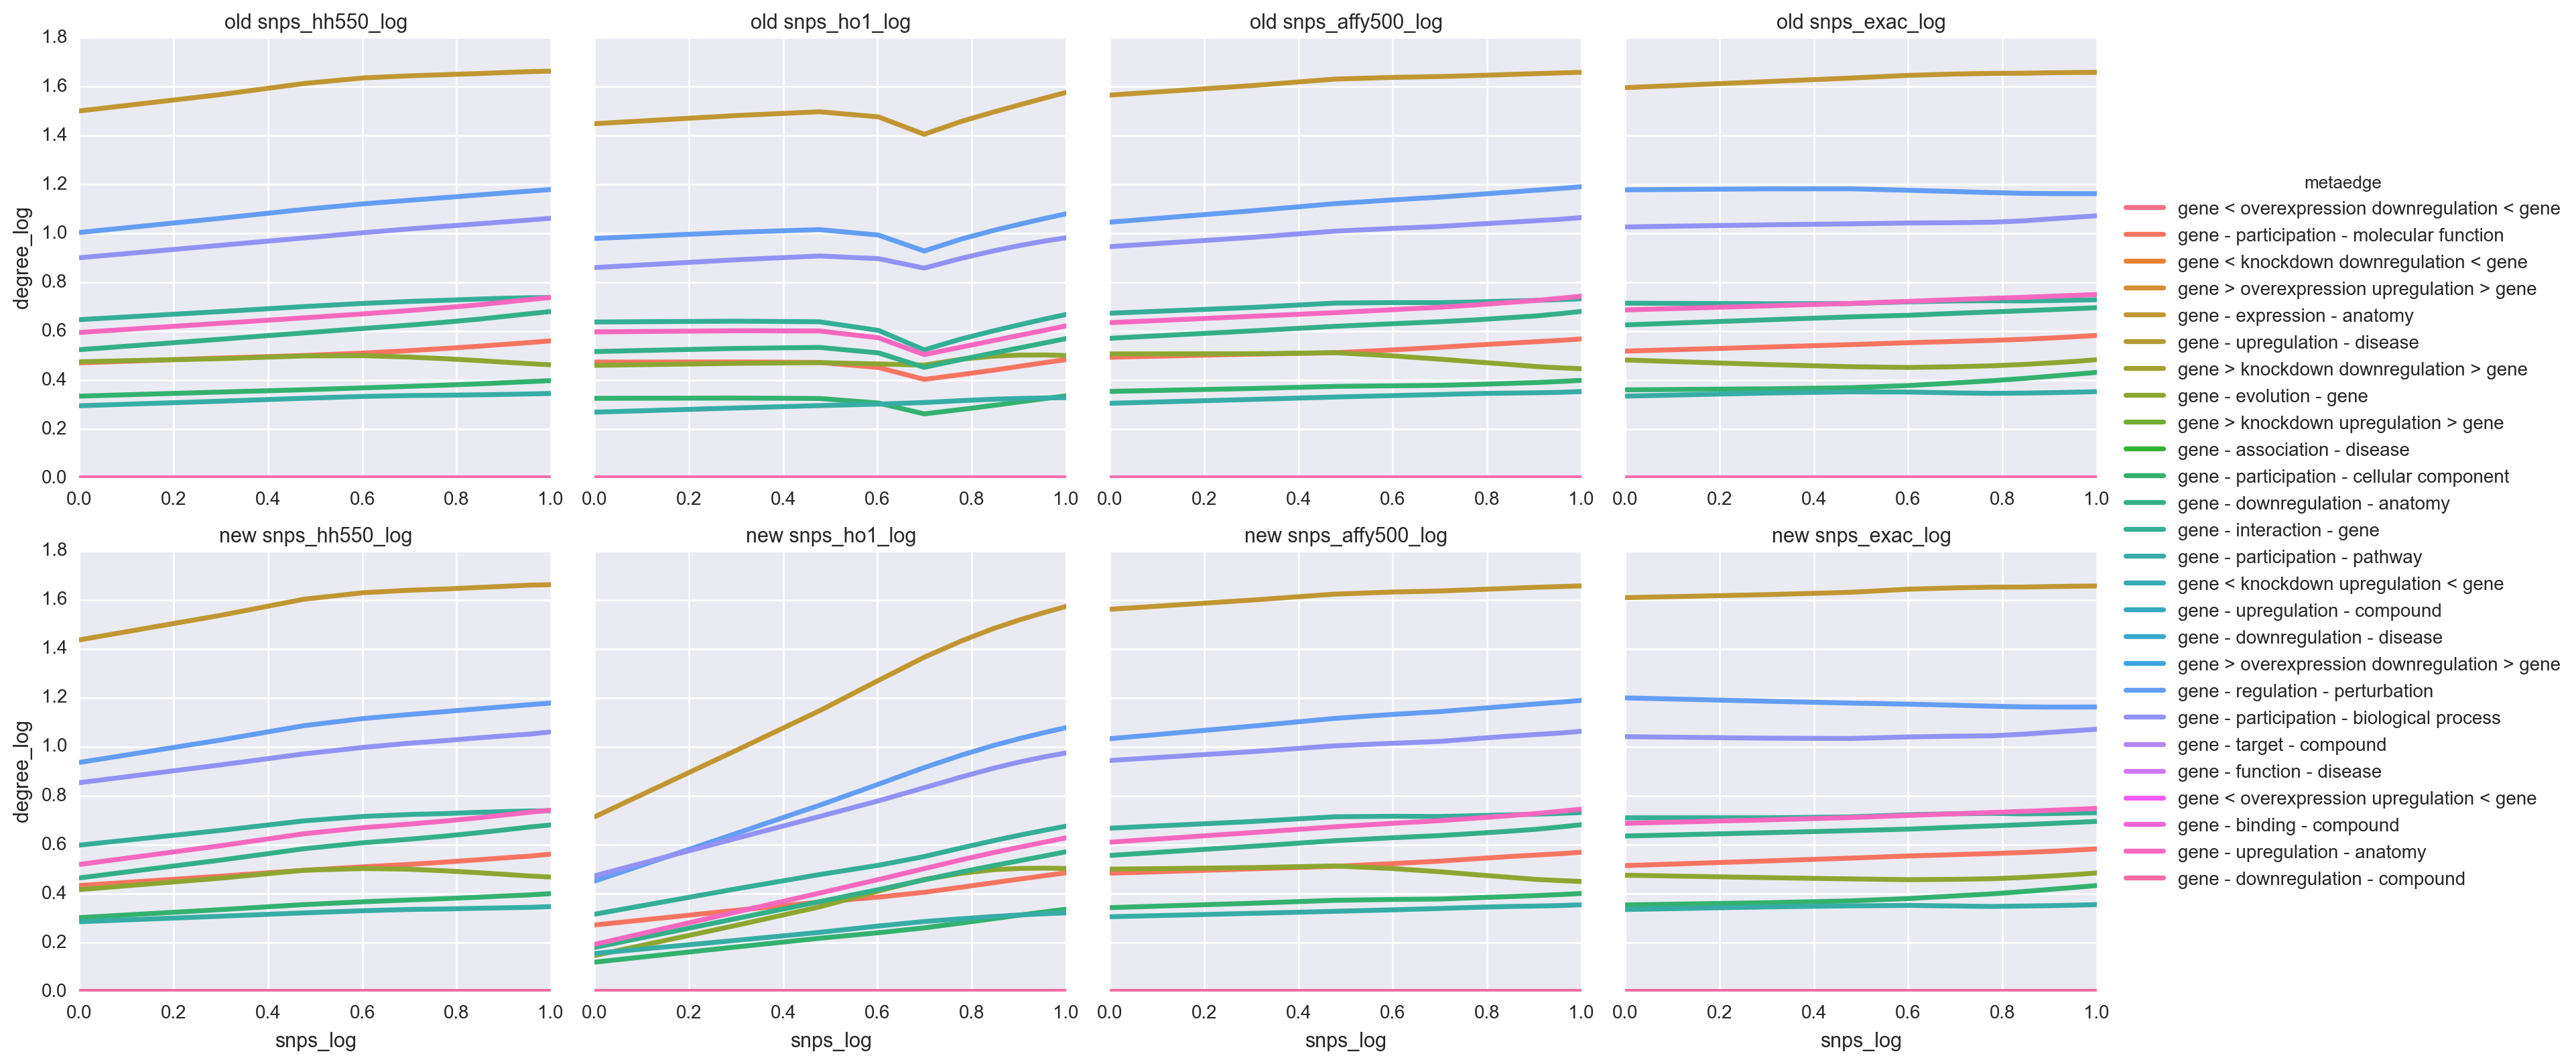
The result is shown below, using lowess curves and with the chrXY-void dataset on the top row and the corrected dataset on the bottom row (notebook):
So... our facets created in ggplot2 were incorrectly labeled. The drastic change from chrXY abundances is real but occurred for HO1 rather than HH550. These findings are consistent with the SNP abundance histograms, where HO1 underwent a drastic change with the chrXY bugfix.
HH550 through b795aa195a2c2f35bafb1e6b33c4819bff30d0a7
HH550 beginning on 5238adf66c9a2566e04ca81666fa6b4d47394fa1
Problem
e783af22b660ad956cf9ea87994ece7e12ff3360 fixed a bug which was leading to all genes on chromosomes X and Y to receive 0 SNPs. The effect on 500K, HO1, and ExAC were minimal. However, the relationships for HH550 changed drastically with very low degrees being estimated for low SNP abundance.