Open SteffenME opened 11 months ago
polygon could be created by full enclosing polygon or by slightly outlier filtered polygon.
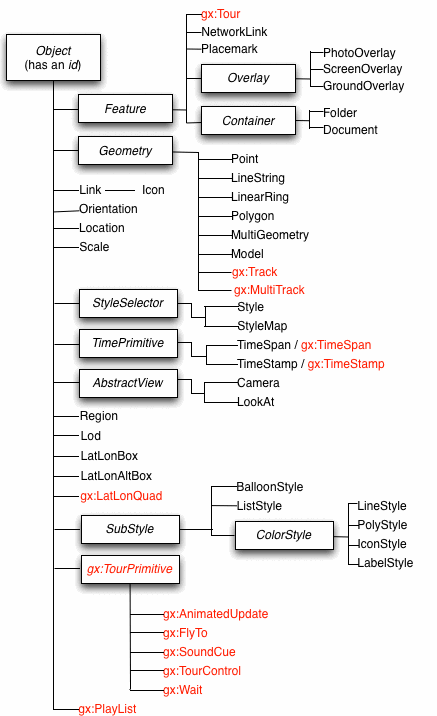
KML it supports acutally more geometrys:

Plotters often do support weather data aka grib files. KML is supported by flight planning tools (if i am not mistaken).
I think the lowest fruit would be plain text in the mail with exact location in dm of clusters
Plotters often do support weather data aka grib files. KML is supported by flight planning tools (if i am not mistaken).
I think the lowest fruit would be plain text in the mail with exact location in dm of clusters
yes this is the lowest possible interface, but the area always resembles a complex geometry, which i think should be at best somehow transported too.
Maybe we should investigate / ask which plotters ship use and then provide some more formats. We dont need to limit us to only one.
KML export all Points with timestamp:
import simplekml
def export_kml(simulation):
    lons,lats=simulation.get_lonlats()
    time_array=simulation.get_time_array()
    kml=simplekml.Kml()
    for i in range(len(time_array[0])):
        for j in range(len(lons[...,i])):
            point=kml.newpoint(name=f'Point{i+j}')
            point.coords=[(lons[j,i],lats[j,i])]
point.timestamp.when=time_array[0][i].strftime('%Y-%m-%dT%H:%M:%S')Density maps can be exported to geotiff with rioxarray. Geotiffs can then be read by opencpn PhotoLayer Plugin
We need a more qualitative output format that gives discreet latitude and longitude to put in a chart plotter. Possible Solution:
See also #81