Hi, could you please be more specific that why you think it's reversed?
Open CharlesEric-95 opened 2 years ago
Hi, could you please be more specific that why you think it's reversed?
Hi, Let me give more details
| About the dataset : | day | is it monday ? | predictions |
|---|---|---|---|
| 0 | 1 | 1 | |
| 0 | 1 | 1 | |
| 0 | 1 | 1 | |
| 1 | 0 | 0 | |
| 2 | 0 | 0 | |
| 3 | 0 | 0 | |
| 4 | 0 | 0 |
Captions :
The model is really simple :
booster[0]:
0:[monday] yes=2,no=1
    1:leaf=-0
    2:leaf=1
In a nutshell : if day = 0 then we're monday else no.
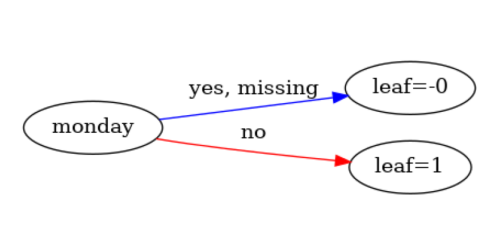
However the graph shows the opposite :

We have : If monday (day = 0) then leaf = 0 (we're not monday) else leaf = 1 (we're monday)
Instead we should have : If monday (day = 0) then leaf = 1 (we're monday) else leaf = 0 (we're not monday)
Seems like the model dump is reversed instead of the plot being reversed. Marked as a bug, will investigate tomorrow.
Thanks for your investigation. Just wanted to say, I strongly believe it is the plot that is wrong since the model dump is consistent with the predictions results : when monday (day = 0), model predicts 1.
Let me know if I can help.
Alright, I forgot the subtleties around specifying int and indicator in mapping.txt. The meaning of "yes" and "no" seems to be suggesting the answer to the query instead of the split condition of tree node. I will need to take a look into the R implementation as well.
Confirming this bug. The problem may lie in the behavior of get_dump with dump_format='dot', which seems to give incorrect output, whereas get_dump with dump_format='json' gives the correct behavior. It may be a result of mixing up the meaning of left and right in src/tree/tree_model.cc, around line 711 or 712, where the usual tree convention (that right is higher) may not be matching with the visualization convention (where right may not be higher).
I believe the
plot_treefunction is reversing labels when displayed.Here is my environment :
Below is a small script to show the reversed labels. The script is building a simple model to predict the boolean : "Is is monday ?" and end up with a perfect model but the graph is reversed.
And the reversed graph :