 Tratcher
commented
7 years ago
Tratcher
commented
7 years ago @rynowak
Closed zorthgo closed 6 years ago
Tratcher
commented
7 years ago @rynowak
 davidfowl
commented
7 years ago
davidfowl
commented
7 years ago Although I might be overlooking something... To my understanding, the memory usage should not be increasing with every call to this method. After the object is created and sent to the UI, the memory should have been freed.
The large object heap is likely biting you here. If you allocate objects > 85KB in size then it'll be put in the LOH and get compacted very rarely. See http://stackoverflow.com/questions/8951836/why-large-object-heap-and-why-do-we-care for more details (or https://github.com/dotnet/coreclr/blob/master/Documentation/botr/garbage-collection.md#design-of-allocator if you want to go deeper).
I can't understand why Asp.net core doesn't seem to be collecting garbage. Last week I let a web service run for a few of days, and my memory usage reached 20GB
What is your service doing that it's creating such large objects? You should try taking a memory dump before it gets too big, that will clearly show you what objects are sticking around and why it's being held onto (you can use visual studio to look at dumps or a more advanced tool like windbg or perfview).
 MhAllan
commented
7 years ago
MhAllan
commented
7 years ago Try to allocate the array from the beginning rather than calling Enumerable.Repeat or compact the memory using GCSettings.LargeObjectHeapCompactionMode (supported in .Net Standard)
 zorthgo
commented
7 years ago
zorthgo
commented
7 years ago Thanks @davidfowl and @MhAllan for the replies. But this example was a contrived one. I just wanted something that would use a noticeable amount of memory so that I could take a screenshot. The truth is that this is happening with any application regardless of the size of the object in question. And to answer your question @davidfowl, my service was just pulling some data from the database with dapper, and returning the resulting object. It was one row of data for each call. So it took a few days for the memory to grow to that amount. I was actually trying to test the DB when I stumbled onto this peculiarity. I had written a little console app at kept calling the method over and over again.
 wanton7
commented
7 years ago
wanton7
commented
7 years ago @zorthgo sure it's not Dapper? If you create your scripts by injecting parameters directly to your SQL scripts like in PHP you'll end up with lot of cached SQL scripts. Here is how Dapper does it https://github.com/StackExchange/Dapper/blob/fe5c270aceab362c936456087a830e6fe1603cac/Dapper/SqlMapper.cs You should use a memory profiler to tell what is keeping references to allocated memory. Visual Studio 2017 should be able to help you just take some snapshots from memory before and after multiple calls to your app and compare those.
 Pinox
commented
7 years ago
Pinox
commented
7 years ago @zorthgo Yes I have also seen this. Was using servicestack in my .net core console app and every time i make a call to the api the memory usage increased by massive amounts 50mb. I assumed it was a VS2017 bug but then confirmed the high usage in the task manager. As zorthgo stated by just making simple calls to api the memory usage increase significantly and does not seem to release memory.
davidfowl
commented
7 years ago Does this only happen on ASP.NET Core on .NET Core or is it also A problem with ASP.NET Core on .NET Framework?
Can you write a similar application using MVC 5 (on System.Web) and verify that you don't see the same behavior?
I can't make any progress from this issue in its current state.
Pinox
commented
7 years ago In my instance I i was using only target framework .NetCoreApp 1.1 and my console app was referencing an object model in a shared project.
Pinox
commented
7 years ago Not sure if this will help anyone. a sample app that calls hellorequest. In this app the startup memory is 85mb , then by repetitive request i managed to push up the memory use to about 145mb. It falls back sometimes to 125mb but then stays there. Not sure if this is normal behavior as I'm not used to .Net Core console apps. i always assumed I was doing something wrong or not instantiating correctly.
https://drive.google.com/open?id=0B0Gm-m-z_U84TU5keWFTMzc1ZWc
 codemasta
commented
7 years ago
codemasta
commented
7 years ago Facing same issue here on an Asp.Net Core application deployed to production with 3000-5000 active users..the memory on the server increased to 15GB yesterday...i have had to configure IIS to recylce the AppPool every 3 hours while i still try to figure out what the issue is.
davidfowl
commented
7 years ago Did anybody take a memory dump and look at what is taking up all of the memory in your particular applications?
 ikourfaln
commented
7 years ago
ikourfaln
commented
7 years ago @davidfowl @Pinox I'm working on a big company, and we want to start a new project with ASP.NET Core, But when I saw this issue, I was afraid :worried: . this is a critical issue and can block lifecycle of our project.
So please, is it related to ASP.NET Core or .NET Core (CoreCLR) ? we will target Full .NET (4.6) that's why I'm asking.
Pinox
commented
7 years ago @ikourfaln in my case I was using .net core console app , servicestack (.net core version) and kestrel. The weird thing is the memory use goes up to a level , then it stops suddenly and it does not go up again. I guess best is to test it on your side with small sample and check behaviour.
Perhaps @zorthgo can check on his side if he sees similiar behaviour in that memory is used to a certain level and then stops increasing as that is the behaviour that I'm seeing. I have updated my sample app to include @zorthgo example and I dont see the memory running away. It goes up but eventually stops.
I did change the source slightly:
public object Any(TestGC request) { const string message = "TEST"; return Enumerable.Repeat(message, 100000); }
ikourfaln
commented
7 years ago @Pinox Thank you, I will check behavior on my side.
 CShepartd
commented
7 years ago
CShepartd
commented
7 years ago How about this bug in 2.0?
 rpampin
commented
7 years ago
rpampin
commented
7 years ago Any news to this? I'm using Core 2 over Net Framework and this is still happening. Each call to a Controller incresed the used memory, but it never goes down. (I used the WebApi Template)
 Gorthog
commented
6 years ago
Gorthog
commented
6 years ago Hi,
I have the same issue with ASP.NET Core 2. I've took a memory dump and tried analyzing. From what I see the problem is exactly as the OP said. My application starts with allocation about 75 MB, and very quickly it goes all the way to ~750MB, out of it 608MB is "Unused memory allocated to .NET".
First snapshot at app start:
Second snapshot after 3 minutes and 100 requests:

 tanwarsatya
commented
6 years ago
tanwarsatya
commented
6 years ago we are also facing same issue, our controller is dealing with large amount of data, ( which is bad design and will be replaced soon ), each call to this controller is causing memory to grow. The memory reduces but only 40-50%( gain 50 Mb, reduces 30-35 Mb ), each call increases memory in range of 10-15 Mb each time. Service is hosted inside service fabric.
 acornies
commented
6 years ago
acornies
commented
6 years ago It looks like I have a similar issue in our production service (20-100 req/s) using a combination of:
The application has a front-end web server and worker (shown respectively in the graphs below).
web server (last 6h)

worker (last 6h)

They both make use of large byte arrays because the service is acting as an object storage proxy, and consequently puts objects in the LOH. My question is, is this a known limitation of .NET Core at the moment? It seems as though the LOH in never fully cleaned up or fragmented.
Having said that, SOH seems to be working fine, as typical web api objects are cleaned up. Any suggestions? Is there a problem with my setup? I've analyzed the code and can't find any glaring memory leaks, and I'm not using anything special outside of ServiceStack library.
 Eilon
commented
6 years ago
Eilon
commented
6 years ago @sebastienros - any thoughts on this? Have we observed any similar behavior in our systems?
 sebastienros
commented
6 years ago Gorthog
commented
6 years ago
sebastienros
commented
6 years ago Gorthog
commented
6 years ago @sebastienros, several questions:
davidfowl
commented
6 years ago What are the results on .net core 2.1? Is the issue resolved because Kestrel is using Span?
We personally haven't seen any evidence that the issue is in Kestrel. It still looks like an application problem.
What if we can't pool arrays - can you provide a workaround? Should we use GCSettings.LargeObjectHeapCompactionMode.CompactOnce?
@jkotas @Maoni0 Any advice here?
 davesmits
commented
6 years ago
davesmits
commented
6 years ago how can I investigate if I suffer the same issue? the LOH according redgate memory profiler is almost emty as @sinapis describes but still using easy more then 1gb for just one user
 jkotas
commented
6 years ago
jkotas
commented
6 years ago Collect trace and analyze it using perfview. There are number of tutorials by Vance and others on how to trace down .NET memory leaks: https://www.bing.com/search?q=.NET%20memory%20leak%20perfview .
https://github.com/dotnet/coreclr/blob/master/Documentation/project-docs/linux-performance-tracing.md has Linux specific instructions for collecting traces.
If you believe that there is no memory leak and GC is just keeping more memory around that you would like, you can try:
 ronald7
commented
6 years ago
ronald7
commented
6 years ago Hi,
I think i am having the same kind of problem with a .Net Core Web API in production.
The application is running on Windows Server 2016 with .Net Core 2.0.3. The machine is a Hyper-V VM with 28 CPU cores and 24GB of RAM. If we don't recycle the IIS application pool often enough, we will eventually use all the available memory. When the application starts using a lot of memory (>=95% of total system memory) the CPU usage also increase strongly (from 2% to 70% sometimes). I am not sure sure if an OOM exception is triggered or not, we always recycle the pool before it happens (the maximum memory usage I have seen was 98% of memory used by dotnet.exe).
Analyzing a production memory dump with ".Net Memory Porfiler" (SciTech Software) here is what i found:

If this analyze is correct, about 95% of the memory is in "overhead > unused". Here is how this memory profiler editor is describing this category (on their forum): "Overhead->Unused" is memory committed by the .NET runtime for the managed heap. It is currently unused, but it is available for future instance allocations. There are lot of rules the runtime uses to decide whether to keep the committed memory or to release it to the OS. It depends on factors like the available memory, allocation patterns, the number of processors, whether the server GC is used, etc.
@jkotas I will apply your recommendations (Windows job object, and switching to workstation GC) and I will let you know the result. Please let me know if i can extract any other useful information from the production memory dumps i have.
Thanks
sebastienros
commented
6 years ago @sinapis @ronald7 Would any of you be able to share an app that shows the issue? If I could repro it we would be able to find the reason, or at least remove some code piece by piece and isolate a minimal repro.
Gorthog
commented
6 years ago @sebastienros I can't share the app, but I can share the session from PerfView session + memory dump. Some description: I have a ASP.NET Core 2 Web API, I've created a load test of 200 users all sending the same request over 10 seconds. Overall 775 requests were processed.
This app jumped to almost 1 GB memory usage in task manager and stayed like that. Looking at the dump I can count about 18 MB:

So the questions is where did almost 1 GB go?
sebastienros
commented
6 years ago @sinapis Thanks
The behavior you are describing is not unexpected, the GC will allocated some memory as necessary on the peak load, and just release it over time. It's the GC Server mode, and usually wait for idle periods to release it and not affect your app perf. The amount of memory it will reserve depends of the total memory available on the system.
We would definitely see an issue if it kept increasing. I assume that if you don't send anymore requests and let your app run you will see the memory usage going down.
Could you run the same thing until it consumes most of your system memory? Or at least long enough with the same load that it will show it growing continuously? I will still get a look at your current dumps.
sebastienros
commented
6 years ago Also can you take dumps during and at the end of the jobs, so we can see the detals.
ronald7
commented
6 years ago Hi @sebastienros
Unfortunately, I cannot share the app nor the memory dumps, but I will create a dummy application (with the same architecture and dependencies), run it on the same machine, if I can reproduce this behavior i will share this one with you. Please let me know if there any useful information I could extract for you from the memory dumps.
I have updated the GC mode from server to workstation on one production server, I will let you know in a few hours from now if it changes anything on the memory usage.
I also performed another test: we are running our application behind a load balancer, on 4 virtual machines. After removing one of the machine from the load balancer pool, the memory used by dotnet.exe did not decrease and remained at the same level even after 30 minutes. (However, the application was still processing a few requests: one request sent by SCOM on a dummy endpoint every 30 seconds). No memory was released and returned to the system.
Thank you
 Maoni0
commented
6 years ago
Maoni0
commented
6 years ago @sinapis I looked at your ETW trace. it is puzzling to me - you survived very little in the last induced gen2 GC yet we still chose to keep that much memory committed. your application seems edge case (you mostly just did only background GCs due to LOH allocations) - I wonder if we have some accounting errors there (another possibility is errors in the numbers reported but if you already verified that you have that much committed that's a smaller possibility). if you could repro with something you can share with me, that'd be fantastic; otherwise if it's possible to run your app with some logging from GC (I can give you a commit that does that) that'd be helpful too.
Gorthog
commented
6 years ago @Maoni0 please share how should I enable GC logging If there is some other data you would like me to provide in order to disprove accounting error please let me know what should I provide you with and how (maybe tell perfview to collect more data?) I'll try creating a minimum repro, but not sure I'll succeed since I don't know where the problem is.
@sebastienros hopefully I will provide another dump with more memory consumption today
ronald7
commented
6 years ago Hi @sebastienros @Maoni0 ,
I ran our application with workstation GC mode for 12 hours but same result. I also recompiled the application with .Net 2.1 Preview 2 on a single production node for 1 hour, i will let you know the result, but for now the process is already using 2GB+ of RAM.

I have PerfView running on this same machine and i am collecting GC dumps, is there an email address where i could send you the OneDrive link, unfortunately i cannot share it directly in this thread.
If it can help i can also collect more metrics or GC logs. Thank you
sebastienros
commented
6 years ago @ronald7 redacted I can forward to @Maoni0
ronald7
commented
6 years ago Hi @sebastienros @Maoni0 I just sent you an email with two PerfView gcdump and a VMMap file, I hope this can help. On my side I am still trying to reproduce this high memory usage behavior with a dummy application.
Thanks!
 SergeySagan
commented
6 years ago
SergeySagan
commented
6 years ago I am also experiencing the same problem. The garbage collection never happens! The screenshot shows memory usage after doing about 50 requests using a fairly simple dotnet core web api app.

 danports
commented
6 years ago
danports
commented
6 years ago I just upgraded an ASP.NET Core app running on Ubuntu 16.04 from 1.1 to 2.0 and ran into this problem. It's pretty severe, causing the kernel to kill the app frequently due to OOM errors, and I'm contemplating whether to downgrade back to 1.x. There are certain pages we can't load at all - even after a Kestrel restart, the app immediately exhausts available memory after a single request! I thought about upgrading the server, but based on the comments here about ASP.NET Core apps using all available memory, I'm not hopeful that will help. Our stack is basically ASP.NET MVC Core + EF Core...nothing too fancy. If I get some time I'll try to create a sample to reproduce the issue - I don't think it should be that hard, given the simplicity of our stack.
FWIW, the system that I upgraded also has a .NET Core console app, and that does not appear to have any memory problems after the 2.0 upgrade, so this definitely appears to be an ASP.NET Core-related issue.
danports
commented
6 years ago Probably related: https://github.com/aspnet/KestrelHttpServer/issues/2214
Maoni0
commented
6 years ago @danports have you tried calling GC.Collect() see if the memory usage goes down dramatically? that would give us a clue where we should start. if GC.Collect() (or the GC.Collect/GC.WaitingForPendingFinalizers/GC.Collect sequent) is not able to make memory usage go down dramatically it means there's simply that much memory that needs to be live so GC cannot reclaim it.
danports
commented
6 years ago @Maoni0 I haven't tried that yet. I don't think my issue is with GC, because I did see memory usage drop from time to time - it just seems like my .NET Core 2.0 apps consume roughly 2-3x the memory they did compared to when they were running on .NET Core 1.1. 😞
I downgraded back to .NET Core 1.1 for now and will revisit this later when I have more time, probably after .NET Core 2.1 is released. (I ran into a pile of issues with 2.0 and this was just one of them.)
SergeySagan
commented
6 years ago GC.Collect() does not help. Tried a very simple ASP.NET Core 2.0 and 2.1 Web API that has one controller that returns a dictionary of 200k ints. The allocated memory keeps going up with each request, even though the app does not use any more memory.
sebastienros
commented
6 years ago @Serjster returning 200K integers (4B) would take 800KB. In this case you are hitting the issue that is explained in this comment: https://github.com/aspnet/Home/issues/1976#issuecomment-289336916
In this case you should use an array pool to reuse them across requests.
wanton7
commented
6 years ago Also good to know is that if code is running in 64bit mode then arrays/list etc. that contains pointers are twice the size compared to 32bit. If I remember correctly full framework runs any cpu code 32bit in 64bit OS by default. So people migrating their code might accidentaly hit LOH issues.
 Jabronironi
commented
6 years ago
Jabronironi
commented
6 years ago I am working with @Serjster , and here is what I have found. If I create a vanilla web api project using asp.net core (I used 2.1 in my latest test), I notice that when I run the diagnostic tool (or even check the process working memory set in code), the number of bytes return keeps climbing as I hit an endpoint. For example, if I have a single web api endpoint returning a Dictionary<int, int> with 20,000 items in it, the following happens:
If the return object is a different sized object, all the numbers above are just bigger/smaller (including the level off amount), but the growth pattern is the same (aka, it will grow and grow until it levels off after many requests).
If I add GC.Collect in the method call (so it occurs on every single request, the level of is much lower, but there is still a period of growth until it levels off.
The other interesting point of detail is the number of objects and the heap size when doing snapshots is largely unchanged with each visit. But the Process Memory graph keeps showing a higher and higher number (this is also true if you grab the process and pull off the working memory set value).
I am beginning to suspect that the graph is showing allocated memory (and this memory grows based on some asp.net core useage/demand forecasting logic), but this is not necessarily consumed/leaked memory. I don't know enough to confirm though, so wondering if someone more knowledgeable may be able to chime in.
EDIT - re @davidfowl comment: Regarding your comment about things getting collected rarely... this could make sense. But how long does it typically take? I can go 30+ seconds in between requests, and the GC never seems to bring that memory number in the diagnostic chart back down. I am sure I am ignorant on something here, but just curious.
EDIT 2 - Now that I have read the SO link that david posted above in more detail, I am starting to think this is definitely the issue we are seeing. If we are running in an environment with limited memory (which we are in our dev environment where we are seeing this because we are being cheap) we run into problems with this.
Edit 3 - One lingering question. Why is the process memory going up consistently, but the heap size not going up if this is a LOH issue? Actually, I may understand this now. The heap is the used memory. The processor allocated memory is the used memory plus the fragmented memory blocks that are unused.
wanton7
commented
6 years ago @RemyArmstro can you change Dictionary<int, int> to SortedDictionary<int, int>? Dictionary is probably allocating continous memory, might even add some extra data to every entry. Way SortedDictionary is implemented it will make many small allocations instead of one big one.
Edit: If you serializing to string and not directly to response output Stream then that might also cause LOH allocations.
SergeySagan
commented
6 years ago @wanton7 Your response is missing the point. Dictionary is just the tip of the iceburg. We can use lists, arrays, etc. etc. and they all do the same thing. However, as was pointed out if the LOH is causing this, as it sounds like it is, then this behavior is probably fine? Except this might have some concerning side effects, like what happens when you run out of memory? Does your app just crash?
wanton7
commented
6 years ago @Serjster ok I thought you had just small cases where this is happening. To me it's very unusual to have big lists, arrays like this and sending this much data in one api call if it's not binary. Usually when you have some sort of web api and get some data from it, you use paging. You shouldn't be sending 10000 entries to client side. But if you have lot of problems like this and there is no way to change how your api works, then I think you should create your own chunked List and Dictionary implementations. If you really use arrays this big then you can replace them with your chunked lists or try to pool them when application starts.
I do wish Microsoft would create chunked implementations that everyone could use in situations like this.
SergeySagan
commented
6 years ago @wanton7 yet again you're missing the point. It doesn't matter the size of the list. Even a single item or a small list causes this problem to happen.
wanton7
commented
6 years ago @Serjster maybe i'm just blind but I don't see any posts from you where you said sending single item or small list will cause this to happen. Did you delete it?
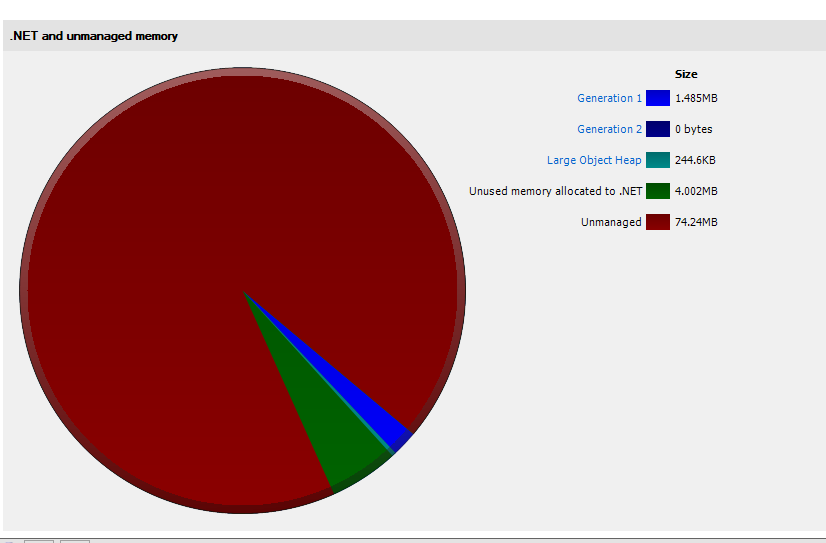
I can't understand why Asp.net core doesn't seem to be collecting garbage. Last week I let a web service run for a few of days, and my memory usage reached 20GB. GC doesn't seem to be working properly. So to test this I wrote a very simple web method that return a large collection of strings. The application started off using only 124MB, but with each time I called the web method, the memory usage kept getting higher and higher until it reached 411MB. It would have gone higher if I had kept calling the web method. But I decided to stop testing.
My test code was this:
Although I might be overlooking something... To my understanding, the memory usage should not be increasing with every call to this method. After the object is created and sent to the UI, the memory should have been freed.
As you can see from the screenshot below, even after the GC got called, the memory was not released.
Thanks for the help! Jay