 strengejacke
commented
1 year ago
strengejacke
commented
1 year ago model_parameters() does not report predictions (that should be in the modelbased package, but I guess not implemented yet). It reports the estimates, SE etc. from the summary. See:
library(metafor)
#> Loading required package: Matrix
#> Loading required package: metadat
#>
#> Loading the 'metafor' package (version 3.8-1). For an
#> introduction to the package please type: help(metafor)
library(parameters)

dat <- metadat::dat.bcg

datRR <- metafor::escalc(measure="RR",
                         data=dat,
                         ai=tpos, bi=tneg, ci=cpos, di=cneg)

res <- metafor::rma(data=datRR,
                         method = "REML",
                         mods = ~ alloc,
                         yi = yi, vi = vi,
                         slab = author)

summary(res)
#>
#> Mixed-Effects Model (k = 13; tau^2 estimator: REML)
#>
#>   logLik  deviance       AIC       BIC      AICc
#> -10.3301   20.6602   28.6602   29.8705   36.6602
#>
#> tau^2 (estimated amount of residual heterogeneity):     0.3615 (SE = 0.2111)
#> tau (square root of estimated tau^2 value):             0.6013
#> I^2 (residual heterogeneity / unaccounted variability): 88.77%
#> H^2 (unaccounted variability / sampling variability):   8.91
#> R^2 (amount of heterogeneity accounted for):            0.00%
#>
#> Test for Residual Heterogeneity:
#> QE(df = 10) = 132.3676, p-val < .0001
#>
#> Test of Moderators (coefficients 2:3):
#> QM(df = 2) = 1.7675, p-val = 0.4132
#>
#> Model Results:
#>
#>                  estimate      se     zval    pval    ci.lb   ci.ub
#> intrcpt           -0.5180  0.4412  -1.1740  0.2404  -1.3827  0.3468
#> allocrandom       -0.4478  0.5158  -0.8682  0.3853  -1.4588  0.5632
#> allocsystematic    0.0890  0.5600   0.1590  0.8737  -1.0086  1.1867
#>
#> ---
#> Signif. codes:  0 '***' 0.001 '**' 0.01 '*' 0.05 '.' 0.1 ' ' 1
model_parameters(res)
#> # Random Effects
#>
#> Parameter         | Coefficient |   SE |         95% CI |      z |      p | Weight
#> ----------------------------------------------------------------------------------
#> Aronson           |       -0.89 | 0.57 | [-2.01,  0.23] |  -1.56 | 0.119  |   3.07
#> Ferguson & Simes  |       -1.59 | 0.44 | [-2.45, -0.72] |  -3.59 | < .001 |   5.14
#> Rosenthal et al.1 |       -1.35 | 0.64 | [-2.61, -0.08] |  -2.09 | 0.036  |   2.41
#> Hart & Sutherland |       -1.44 | 0.14 | [-1.72, -1.16] | -10.19 | < .001 |  49.97
#> Vandiviere et al  |       -1.62 | 0.47 | [-2.55, -0.70] |  -3.43 | < .001 |   4.48
#> TPT Madras        |        0.01 | 0.06 | [-0.11,  0.14] |   0.19 | 0.849  | 252.42
#> Coetzee & Berjak  |       -0.47 | 0.24 | [-0.94,  0.00] |  -1.98 | 0.048  |  17.72
#> Overall           |       -0.45 | 0.52 | [-1.46,  0.56] |  -0.87 | 0.385  |
#>
#> # alternate
#>
#> Parameter            | Coefficient |   SE |         95% CI |     z |      p | Weight
#> ------------------------------------------------------------------------------------
#> Frimodt-Moller et al |       -0.22 | 0.23 | [-0.66,  0.23] | -0.96 | 0.336  |  19.53
#> Stein & Aronson      |       -0.79 | 0.08 | [-0.95, -0.62] | -9.46 | < .001 | 144.81
#> Overall              |       -0.52 | 0.44 | [-1.38,  0.35] | -1.17 | 0.240  |
#>
#> # systematic
#>
#> Parameter          | Coefficient |   SE |         95% CI |     z |      p | Weight
#> ----------------------------------------------------------------------------------
#> Rosenthal et al.2  |       -1.37 | 0.27 | [-1.90, -0.84] | -5.07 | < .001 |  13.69
#> Comstock et al.1   |       -0.34 | 0.11 | [-0.56, -0.12] | -3.05 | 0.002  |  80.57
#> Comstock & Webster |        0.45 | 0.73 | [-0.98,  1.88] |  0.61 | 0.541  |   1.88
#> Comstock et al.2   |       -0.02 | 0.27 | [-0.54,  0.51] | -0.06 | 0.948  |  14.00
#> Overall            |        0.09 | 0.56 | [-1.01,  1.19] |  0.16 | 0.874  |
#>
#> Uncertainty intervals (equal-tailed) and p-values (two-tailed) computed
#>   using a Wald z-distribution approximation.
Created on 2022-09-03 with reprex v2.0.2
The "Overall" rows correspond to the three estimates from the summary.
 arthur-albuquerque
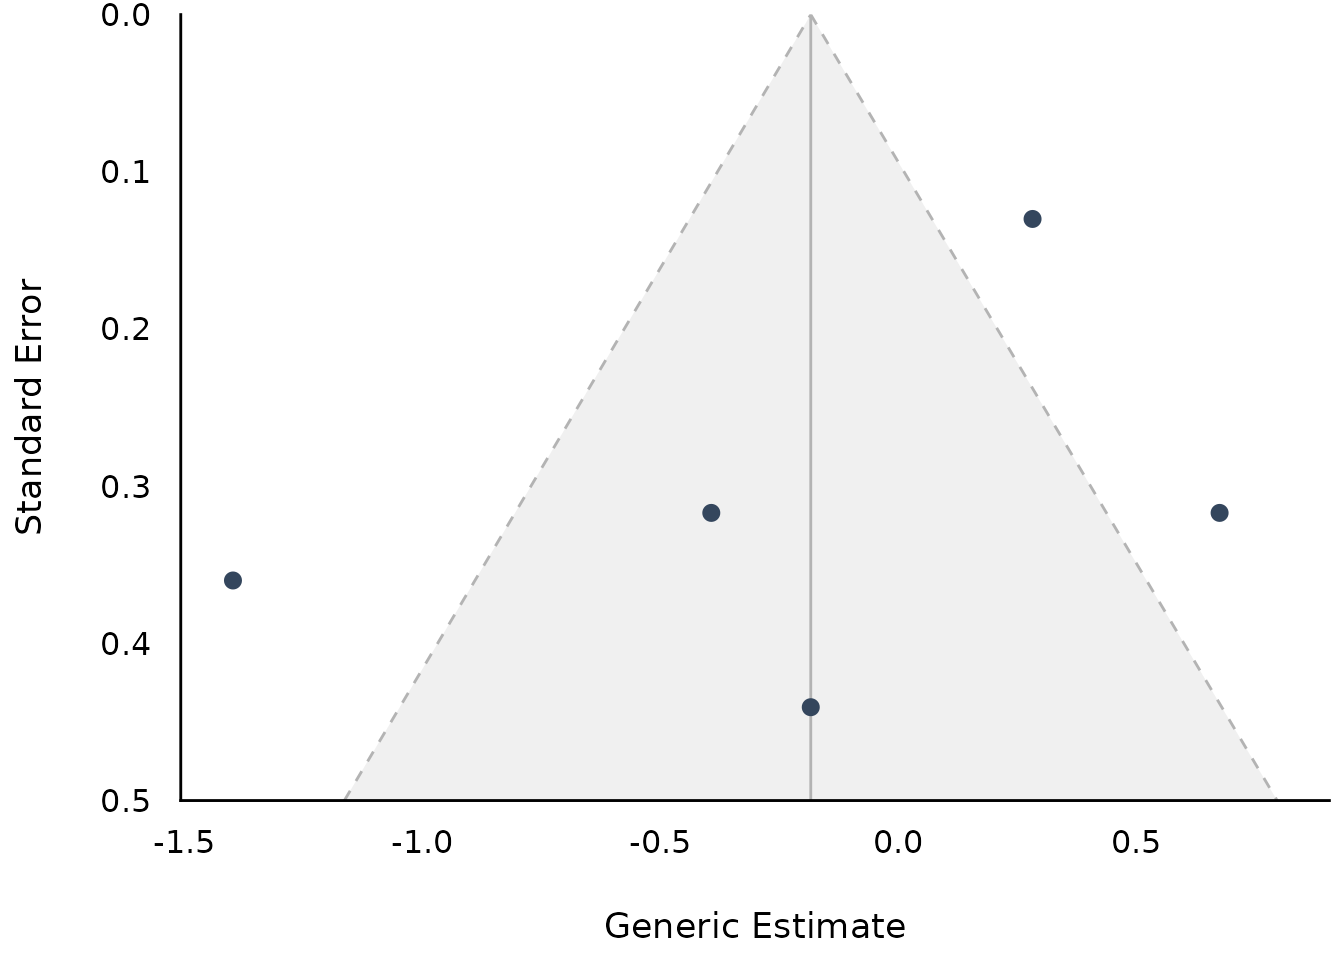


 bwiernik
 vincentarelbundock
 wviechtb
Hi,
It seems that
model_parameters()isn't calculating the correct point estimate (and 95% CI) for all subgroups in a metafor::rma() object. Below, I show thatpredict()andemmeans()yield the same results for all subgroups, whilemodel_parameters()only recovers the "alternate" subgroup correctly.Created on 2022-09-03 with reprex v2.0.2