ejmahler / RustFFT

RustFFT is a high-performance FFT library written in pure Rust.
Apache License 2.0
678 stars 47 forks source link

Unclear position of coefficients #104

Open Aandreba opened 1 year ago

Aandreba commented 1 year ago

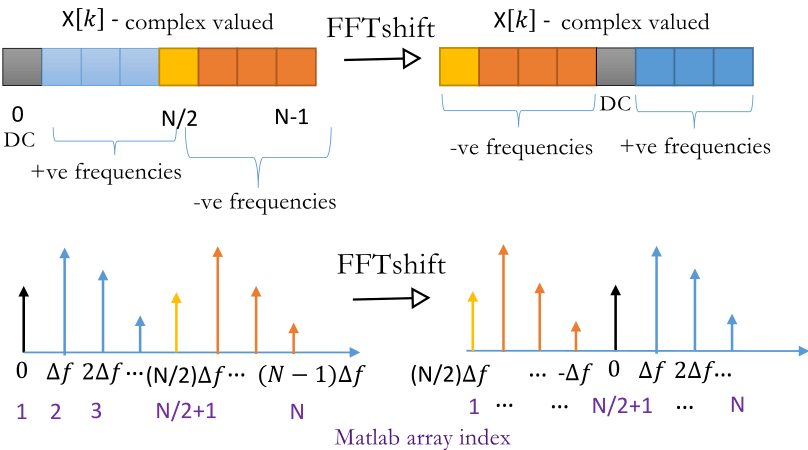
Currently, the output order of the coefficients is documented as:

Elements in the output are ordered by ascending frequency, with the first element corresponding to frequency 0.

But this is a very unspecific definition, and could lead to various conclusions, like for example (for an input buffer of size n):

A better explanation in the documentation would be very helpful. Failing that, a couple examples would also serve the purpose of showing in greater detail the output order.

ejmahler commented 1 year ago

I come to FFTs from a non-theoretical background, so my understanding of the order is mostly a practical one: The order of the results is the same as if you applied the naive DFT formula:

X_k = sum(n from 0 to N) x_n * e^(-ikn2pi / N)

What's the best way to express this? Should it just say exactly that?

Easyoakland commented 1 year ago

To confirm is the following correct?

Given X = frequency vector of length N from fft: ● X[0] represents DC frequency component ● X[1] to X[N/2-1] terms are positive frequency components ● X[N/2] is the Nyquist frequency (F_s/2) ● X[N/2+1] to X[N] terms are negative frequency components

Like the top left image here?

HEnquist commented 1 year ago

How about just adding a simple example?

Output of a 6-point FFT:
FFT(x) = [(X0r, X0i), (X1r, X1i), (X2r, X2i), (X3r, X3i), (X4r, X4i), (X5r, X5i)]
with frequencies: [0, fs*1/6, fs*2/6, fs*3/6 (Nyquist), -fs*2/6, -fs*1/6]

A bit like how it's done for RealFFT: https://github.com/HEnquist/realfft/blob/master/README.md?plain=1#L34

ejmahler commented 1 year ago

What does fs represent in that example?

HEnquist commented 1 year ago

It also needs a short text to go with it. fs is the sampling frequency. I think it makes sense to keep an example like this very simple and just write about signals measured as function of time. So sampling frequency in Hz.

HEnquist commented 1 year ago

Something like this?

The FFT output format.

In this example x is a vector of 6 complex values. The values are samples of a complex signal that changes as function of time, recorded at a sample rate (fs) of 48 kHz.

Transforming the signal using a 6-point FFT results in a sequence of 6 new complex values: FFT(x) = [(X0r, X0i), (X1r, X1i), (X2r, X2i), (X3r, X3i), (X4r, X4i), (X5r, X5i)]

The coefficients are returned ordered by frequency. The first half are the positive frequencies up to fs/2. Then the second half are the negative frequencies in descending magitude. For this example of 6 elements the frequencies are: [0, fs*1/6, fs*2/6, fs*3/6 (Nyquist), -fs*2/6, -fs*1/6] = [0, 8kHz, 16kHz, 24kHz, -16kHz, -8kHz]

I'm not aware of any nice intuitive explanation of what the negative frequencies mean.