elastic / helm-charts

You know, for Kubernetes
Apache License 2.0
1.89k stars 1.93k forks source link

[elasticsearch] Add lifecycle hooks #190

Closed tetianakravchenko closed 5 years ago

tetianakravchenko commented 5 years ago

Describe the feature: Add option to provide custom start/stop hooks

Describe a specific use case for the feature: For coordination nodes, I want to add pre-stop hook to wait before sending SIGTERM to complete already open connections. Otherwise, during the rolling restart client pods will be killed and all active connection will be dropped.

Crazybus commented 5 years ago

Add option to provide custom start/stop hooks

👍

For coordination nodes, I want to add pre-stop hook to wait before sending SIGTERM to complete already open connections. Otherwise, during the rolling restart client pods will be killed and all active connection will be dropped.

Is Elasticsearch really not waiting for these connections to be completed? If the connections are really long running then it is possible you might need to increase the terminationGracePeriod to make sure that Kubernetes doesn't kill the pod too early.

https://github.com/elastic/helm-charts/blob/2d309cbfb25ca0f5d3c3633445144d2c5ed1de54/elasticsearch/values.yaml#L135-L136

What would you be adding as a preStop hook to prevent this behavior? I'm interested since it sounds like something that maybe should be added into the helm chart by default. Or that it needs to also be fixed in Elasticsearch itself too.
tetianakravchenko commented 5 years ago

@Crazybus thank you for your reply!

Is Elasticsearch really not waiting for these connections to be completed?

I've tried with sample data provided here https://www.elastic.co/guide/en/kibana/current/tutorial-load-dataset.html (logstash indexes). Setup: 5 nodes with dedicated client nodes:

test-client-0   1/1     Running       0          2m45s
test-client-1   1/1     Running       0          2m45s
test-master-0   1/1     Running   0          5m41s
test-master-1   1/1     Running   0          5h23m
test-master-2   1/1     Running   0          11m

IP address of test-client-0:

[root@test-client-0 elasticsearch]# hostname -i
10.32.22.115

I've used this query (query is not so important here), run it from test-master-2 container:

[root@test-master-2 elasticsearch]# curl -XGET -o /dev/null  -H 'Content-Type: application/json' http://10.32.22.115:9200/_search -d'
{
 "query": {
    "bool": {
      "must": {
        "match_all": {}
      },
      "should" : [
        { "regexp" : { "ip" : ".<1-99>*<1-5><0-7>*" } },
        { "regexp" : { "agent" : ".oz*5*" } },
        { "regexp" : { "referer" : "..tp?://.*com|org" } }
      ]
    }
  },
 "sort": [
   { "utc_time": { "order": "desc" }}
 ],
 "size": 10000
}'
  % Total    % Received % Xferd  Average Speed   Time    Time     Time  Current
                                 Dload  Upload   Total   Spent    Left  Speed
100   348    0     0  100   348      0    221  0:00:01  0:00:01 --:--:--   221
curl: (52) Empty reply from server

If delete test-master-0 during that time, I get:

curl: (52) Empty reply from server

If the connections are really long running then it is possible you might need to increase the terminationGracePeriod to make sure that Kubernetes doesn't kill the pod too early.

for my test setup I didn't change default value https://github.com/elastic/helm-charts/blob/master/elasticsearch/values.yaml#L144 As I understand from https://kubernetes.io/docs/concepts/workloads/pods/pod/#termination-of-pods as preStop hook is not defined SIGTERM is sent immediately.

What would you be adding as a preStop hook to prevent this behavior?

Now I use:

#!/bin/bash
# Give k8s some time to remove pod's labels (remove it from LB)
sleep 10

while true
do
   netstat -nt | grep ':9200' | grep ESTABLISHED > /dev/null || break
done

but only for coordination nodes (as I use https://github.com/helm/charts/tree/master/stable/elasticsearch approach). It should be safe according to https://kubernetes.io/docs/concepts/workloads/pods/pod/#termination-of-pods:

If one of the Pod’s containers has defined a preStop hook, it is invoked inside of the container. If the preStop hook is still running after the grace period expires, step 2 is then invoked with a small (2 second) extended grace period.
Crazybus commented 5 years ago

Even though #197 is merged I'd like to keep this open until I can see if I can reproduce your issue. If a workaround is needed (by adding a lifecycle hook) then its something we should also make sure is fixed upstream in Elasticsearch.

Crazybus commented 5 years ago

Before I try to reproduce this, are you running the latest Elasticsearch version?

tetianakravchenko commented 5 years ago

For example described in the previous comment I used 7.1.1, but I also could reproduce that for 6.x

Crazybus commented 5 years ago

Thanks, that's all the info I needed. I just wanted to be sure that it wasn't an ancient version where this might have already been fixed. I'm going to try and reproduce it now.

Crazybus commented 5 years ago

Despite your perfect instructions I'm afraid that I'm having some trouble reproducing this. The weird part is that read queries should never die even if the master status is lost.

If delete test-master-0 during that time, I get:

Was test-master-0 the elected leader at the time you deleted it? I tried deleting the current leader and also masters that weren't leaders.

I'm running the test query in a continuous loop like this and then deleting the current leader.

while true ; do date; time curl -s -XGET -o /dev/null  -H 'Content-Type: application/json' http://10.28.3.194:9200/_search -d'
{
 "query": {
    "bool": {
      "must": {
        "match_all": {}
      },
      "should" : [
        { "regexp" : { "ip" : ".<1-92>*<1-5><0-7>*" } },
        { "regexp" : { "agent" : ".oz*5*" } },
        { "regexp" : { "referer" : "..tp?://.*scom|org" } }
      ]
    }
  },
 "sort": [
   { "utc_time": { "order": "desc" }}
 ],
 "size": 10000
}'; done
  1. Is this something you can reproduce consistently every time? Or does it take a few attempts to get it?
  2. How long does it take for your query to run? Mine completes in around 1 second on average.
tetianakravchenko commented 5 years ago

@Crazybus I'm really sorry, I've just found mistake in my instructions, instead of test-master-0 it should be test-client-0, so the idea is that I'm running curl against test-client-0 (using test-client-0 IP in curl http://10.28.3.194:9200/_search) and during processing I'm killing this test-client-0 pod, seems that elasticsearch after receiving SIGTERM just drop all already open connections, for this use case I want to add pre-stop hook.

$ kubectl delete pod test-client-0   <-  to have "fresh" container without cache
$ kubectl exec test-client-0 -- hostname -i
10.60.9.55

wait when pod will be in state Running In this case first request will be ~2s (all next executions will be faster, I guess due to linux caching):

time curl -XGET -o /dev/null -H 'Content-Type: application/json' http://10.60.9.55:9200/_search -d'
> {
>  "query": {
>     "bool": {
>       "must": {
>         "match_all": {}
>       },
>       "should" : [
>         { "regexp" : { "ip" : ".<1-99>*<1-5><0-7>*" } },
>         { "regexp" : { "agent" : ".oz*5*" } },
>         { "regexp" : { "referer" : "..tp?://.*com|org" } }
>       ]
>     }
>   },
>  "sort": [
>    { "utc_time": { "order": "desc" }}
>  ],
>  "size": 500000
> }'
  % Total    % Received % Xferd  Average Speed   Time    Time     Time  Current
                                 Dload  Upload   Total   Spent    Left  Speed
100 51.7M  100 51.7M  100   349  24.6M    166  0:00:02  0:00:02 --:--:-- 24.6M

real    0m2.105s
user    0m0.015s
sys 0m0.031s

(note: I've increased "size": 500000, but it doesn't change response time much) to reproduce I run kubectl delete pod test-client-0 withing the first run and get:

curl: (52) Empty reply from server

It looks a bit artificial, but it is due to used dataset, maybe you can suggest something better? or slower search query?

Thank you for taking the time!

Crazybus commented 5 years ago

That makes a lot more sense now. I'll test that out!

seems that elasticsearch after receiving SIGTERM just drop all already open connections, for this use case I want to add pre-stop hook.

Just in case I wasn't clear earlier, a workaround might be needed for this but if it really is reproducible then I want to make sure that it is fixed upstream in Elasticsearch. As this isn't going to be a problem specific to running Elasticsearch on Kubernetes but will apply in a lot of other setups too.

Crazybus commented 5 years ago

I'm still not having any luck reproducing it :( My theory is that your testing might actually be sending the query to test-client-0 after it is has already gracefully shutdown and been removed from the service. Could you try and reproduce this issue by running the query against the service itself? If you can reproduce it talking to the service, and only kill one container at a time then I can be sure that this is a real issue.

So your curl query would look something like:

curl -XGET -o /dev/null -H 'Content-Type: application/json' http://test-client:9200/_search

I have been running this in a continuous loop while deleting test-client-0 everytime it gets back into the service and couldn't cause a query to fail.

tetianakravchenko commented 5 years ago

@Crazybus thank you for taking the time!

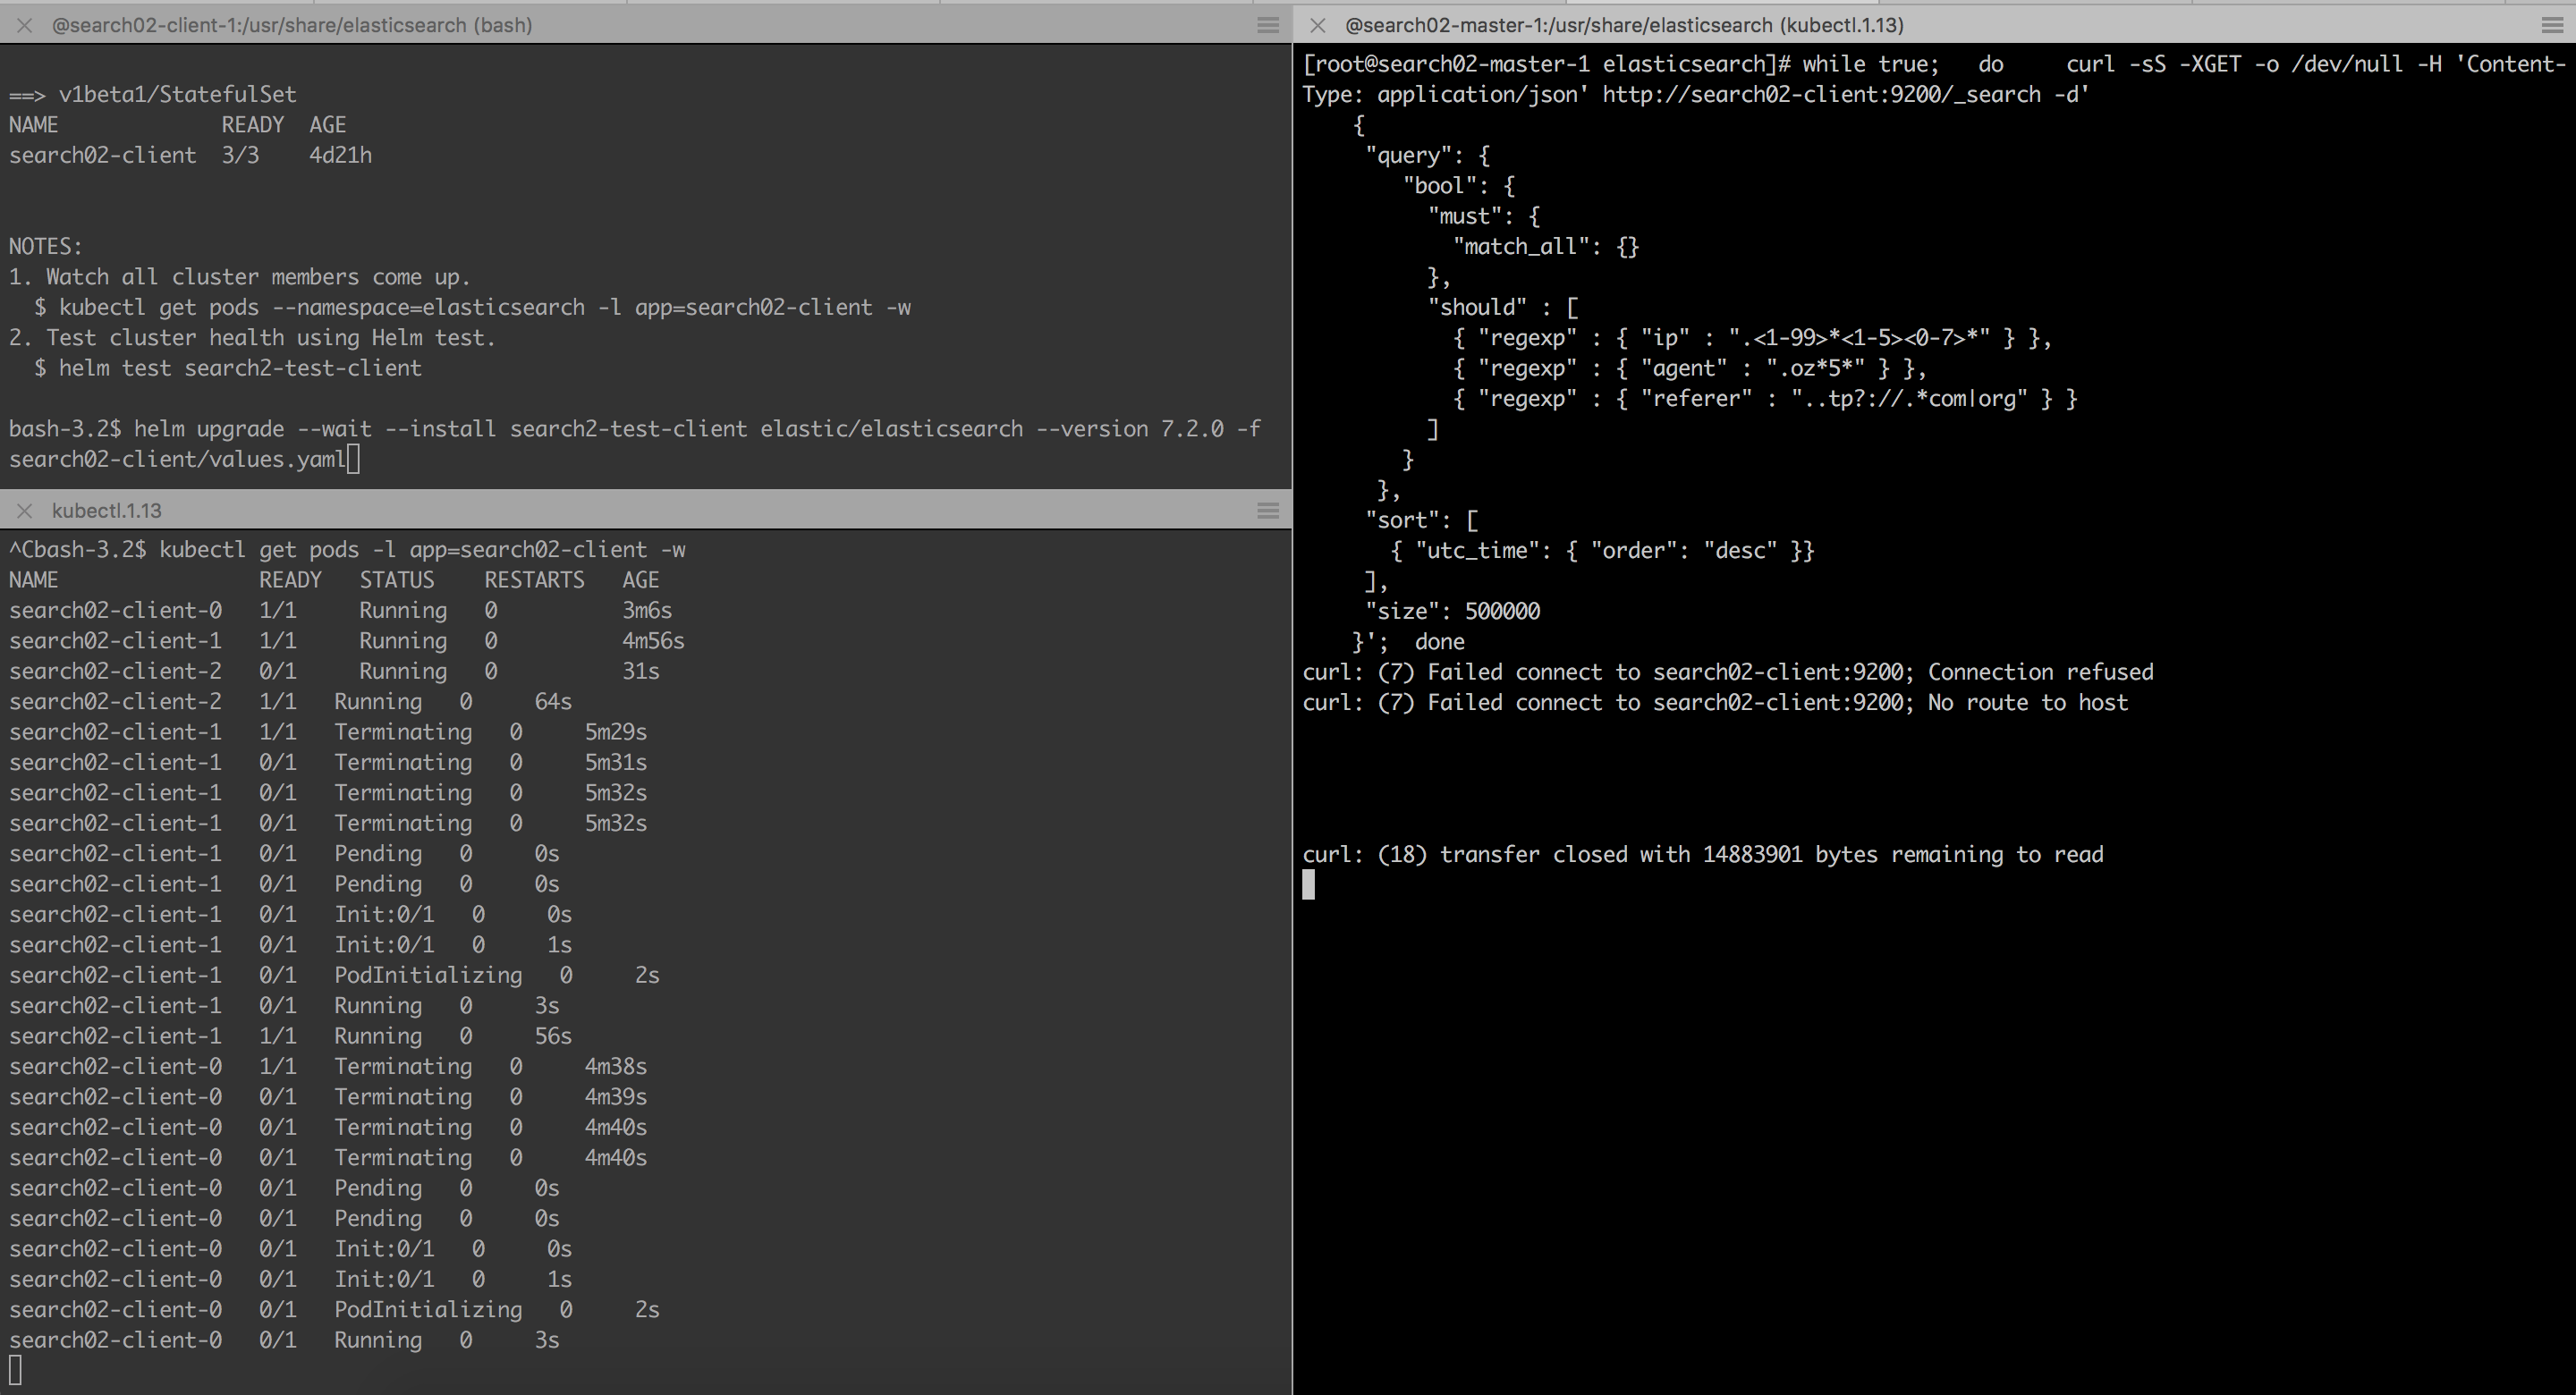
Instead of removing only 1 pod, I've tried to imitate helm upgrade process to encrease possibility that at least for one pods connection will be dropped: in one window I run helm upgrade --wait --install search2-test-client elastic/elasticsearch --version 7.2.0 -f search02-client/values.yaml content of the values:

clusterName: "search02"
nodeGroup: "client"
roles:
  master: "false"
  ingest: "false"
  data: "false"
replicas: 3
persistence:
  enabled: false
image: docker.elastic.co/elasticsearch/elasticsearch
imageTag: 7.1.1
esConfig:
  elasticsearch.yml: |
    transport:
      tcp:
        compress: false

this configuration is used only to ensure that pods recreation will be triggered (transport.tcp.compression: false is default value anyhow), I just add/remove it and run helm upgrade:

esConfig:
  elasticsearch.yml: |
    transport:
      tcp:
        compress: false

In first run, restart of client-2 (replicas: 3) caused no error, but restart of client-1 caused connection refused, restart of client-0 caused transfer closed (really don't remember this error previously removing only one pod):

Screen Shot 2019-07-14 at 22 19 04

second run (here I got curl: (52) Empty reply from server only during deployment of 1 pod):

Screen Shot 2019-07-14 at 22 23 09

third:

Screen Shot 2019-07-14 at 22 35 01

Those are not some selected results, but 3 sequent tests

tetianakravchenko commented 5 years ago

Hi @Crazybus, any updates on this issue? maybe should I open issue in elasticsearch repo directly?

Crazybus commented 5 years ago

Sorry for the slow reply. Had a few busy couple of weeks. Did you get a chance to try this by running the tests directly to the service as I suggested in https://github.com/elastic/helm-charts/issues/190#issuecomment-510027364 ?

What you are showing me in the screenshots looks perfectly normal. If you look at the first one you are sending the curl request to search02-client which Kubernetes is currently showing as being "not ready" with 0/1 because it is still starting up after being upgraded. When a pod is in this state "not ready" Kubernetes removes it from the service/loadbalancer to make sure traffic isn't being sent to it. If you send traffic directly to the pod while upgrading it is very normal to expect failures like this.

tetianakravchenko commented 5 years ago

@Crazybus in the example I described in https://github.com/elastic/helm-charts/issues/190#issuecomment-511234196 was used curl command:

curl -sS -XGET -o /dev/null -H 'Content-Type: application/json' http://search02-client:9200/_search -d'....'

where search02-client is a service name (not one pod), which have 3 pods in Endpoints.

Crazybus commented 5 years ago

🤦‍♂ Sorry I'm blind. I saw 02 and immediately that that it was the second node. I'll see if I can reproduce it now!

Crazybus commented 5 years ago

Reproduced and confirmed! The reason I was having such a hard time reproducing the issue is that my cluster was responding a lot faster than yours (normally under 1 second). So I updated the CPU resource limit to be very low (0.1 cpus) to make the queries last around 10 seconds. By doing this I was able to reproduce the behavior that you are seeing as well.

I decided to see if I could reproduce this with a single node cluster running in docker locally to rule out any weirdness with Kubernetes not sending proper signals through. This is the script which I'm using to reproduce it:

#!/usr/bin/env bash

CPUS="0.1"
SLEEP_TIME="5"

set -euo pipefail

function sleep_then_stop () {
    sleep $SLEEP_TIME
    docker stop -t 60 elasticsearch
    docker logs --since 30s elasticsearch
}

function query_es () {
    time curl -XGET -o /dev/null  -H 'Content-Type: application/json' http://localhost:9200/_search -d'
    {
     "query": {
        "bool": {
          "must": {
            "match_all": {}
          },
          "should" : [
            { "regexp" : { "ip" : ".<1-92>*<1-5><0-7>*" } },
            { "regexp" : { "agent" : ".oz*5*" } },
            { "regexp" : { "referer" : "..tp?://.*scom|org" } }
          ]
        }
      },
     "sort": [
       { "utc_time": { "order": "desc" }}
     ],
     "size": 10000
    }'
}

if docker inspect elasticsearch; then
    docker start elasticsearch
else
    docker run --name elasticsearch -d -p 9200:9200 -p 9300:9300 -e "discovery.type=single-node" docker.elastic.co/elasticsearch/elasticsearch:7.2.0
fi

docker update --cpus 2 elasticsearch

until curl localhost:9200; do sleep 1; done

if ! [ -f "logs.jsonl" ] ; then
    curl -O https://download.elastic.co/demos/kibana/gettingstarted/8.x/logs.jsonl.gz
    gunzip logs.jsonl.gz
fi

if ! curl localhost:9200/_cat/indices | grep logstash; then
    curl  -H 'Content-Type: application/x-ndjson' -XPOST 'localhost:9200/_bulk?pretty' --data-binary @logs.jsonl
fi

echo "*********************"

echo "Before CPU limit"
query_es
echo "*********************"
echo

docker update --cpus $CPUS elasticsearch

echo "*********************"
echo "After CPU limit"
query_es
echo "*********************"

echo "*********************"
echo "After CPU limit with graceful stop after $SLEEP_TIME seconds"
sleep_then_stop &
query_es
echo "*********************"

Depending on your own hardware you might need to tweak the CPU limit CPUS or the sleep timer SLEEP_TIME to consistently reproduce it. With these settings my benchmarks look like:

Without CPU limit: real    0m1.729s
With    CPU limit: real    0m20.899s
With STOP + limit: real    0m7.387s

So the stop is coming in around half way from the query which you can see failing in the output with the Empty reply from server error.

And these are the logs that I'm seeing which are grabbed after the Elasticsearch container has stopped.

{"type": "server", "timestamp": "2019-07-30T14:52:13,915+0000", "level": "INFO", "component": "o.e.m.j.JvmGcMonitorService", "cluster.name": "docker-cluster", "node.name": "40a5dff89f7f", "cluster.uuid": "ErXDUGkORl--NnJwiYFINw", "node.id": "WmLyycgDR32y1ULuaD1npw",  "message": "[gc][20] overhead, spent [501ms] collecting in the last [1.5s]"  }
{"type": "server", "timestamp": "2019-07-30T14:52:25,717+0000", "level": "INFO", "component": "o.e.n.Node", "cluster.name": "docker-cluster", "node.name": "40a5dff89f7f", "cluster.uuid": "ErXDUGkORl--NnJwiYFINw", "node.id": "WmLyycgDR32y1ULuaD1npw",  "message": "stopping ..."  }
{"type": "server", "timestamp": "2019-07-30T14:52:26,418+0000", "level": "WARN", "component": "o.e.c.r.a.DiskThresholdMonitor", "cluster.name": "docker-cluster", "node.name": "40a5dff89f7f", "cluster.uuid": "ErXDUGkORl--NnJwiYFINw", "node.id": "WmLyycgDR32y1ULuaD1npw",  "message": "flood stage disk watermark [95%] exceeded on [WmLyycgDR32y1ULuaD1npw][40a5dff89f7f][/usr/share/elasticsearch/data/nodes/0] free: 1.6gb[2.8%], all indices on this node will be marked read-only"  }
{"type": "server", "timestamp": "2019-07-30T14:52:27,216+0000", "level": "INFO", "component": "o.e.x.w.WatcherService", "cluster.name": "docker-cluster", "node.name": "40a5dff89f7f", "cluster.uuid": "ErXDUGkORl--NnJwiYFINw", "node.id": "WmLyycgDR32y1ULuaD1npw",  "message": "stopping watch service, reason [shutdown initiated]"  }
{"type": "server", "timestamp": "2019-07-30T14:52:27,614+0000", "level": "INFO", "component": "o.e.x.m.p.l.CppLogMessageHandler", "cluster.name": "docker-cluster", "node.name": "40a5dff89f7f", "cluster.uuid": "ErXDUGkORl--NnJwiYFINw", "node.id": "WmLyycgDR32y1ULuaD1npw",  "message": "[controller/101] [Main.cc@150] Ml controller exiting"  }
{"type": "server", "timestamp": "2019-07-30T14:52:27,813+0000", "level": "INFO", "component": "o.e.x.m.p.NativeController", "cluster.name": "docker-cluster", "node.name": "40a5dff89f7f", "cluster.uuid": "ErXDUGkORl--NnJwiYFINw", "node.id": "WmLyycgDR32y1ULuaD1npw",  "message": "Native controller process has stopped - no new native processes can be started"  }
{"type": "server", "timestamp": "2019-07-30T14:52:30,021+0000", "level": "ERROR", "component": "i.n.u.c.D.rejectedExecution", "cluster.name": "docker-cluster", "node.name": "40a5dff89f7f", "cluster.uuid": "ErXDUGkORl--NnJwiYFINw", "node.id": "WmLyycgDR32y1ULuaD1npw",  "message": "Failed to submit a listener notification task. Event loop shut down?" ,
"stacktrace": ["java.util.concurrent.RejectedExecutionException: event executor terminated",
"at io.netty.util.concurrent.SingleThreadEventExecutor.reject(SingleThreadEventExecutor.java:846) ~[netty-common-4.1.35.Final.jar:4.1.35.Final]",
"at io.netty.util.concurrent.SingleThreadEventExecutor.offerTask(SingleThreadEventExecutor.java:329) ~[netty-common-4.1.35.Final.jar:4.1.35.Final]",
"at io.netty.util.concurrent.SingleThreadEventExecutor.addTask(SingleThreadEventExecutor.java:322) ~[netty-common-4.1.35.Final.jar:4.1.35.Final]",
"at io.netty.util.concurrent.SingleThreadEventExecutor.execute(SingleThreadEventExecutor.java:757) ~[netty-common-4.1.35.Final.jar:4.1.35.Final]",
"at io.netty.util.concurrent.DefaultPromise.safeExecute(DefaultPromise.java:766) [netty-common-4.1.35.Final.jar:4.1.35.Final]",
"at io.netty.util.concurrent.DefaultPromise.notifyListeners(DefaultPromise.java:423) [netty-common-4.1.35.Final.jar:4.1.35.Final]",
"at io.netty.util.concurrent.DefaultPromise.setValue0(DefaultPromise.java:540) [netty-common-4.1.35.Final.jar:4.1.35.Final]",
"at io.netty.util.concurrent.DefaultPromise.setFailure0(DefaultPromise.java:533) [netty-common-4.1.35.Final.jar:4.1.35.Final]",
"at io.netty.util.concurrent.DefaultPromise.setFailure(DefaultPromise.java:106) [netty-common-4.1.35.Final.jar:4.1.35.Final]",
"at io.netty.channel.DefaultChannelPromise.setFailure(DefaultChannelPromise.java:89) [netty-transport-4.1.35.Final.jar:4.1.35.Final]",
"at io.netty.channel.AbstractChannelHandlerContext.safeExecute(AbstractChannelHandlerContext.java:1020) [netty-transport-4.1.35.Final.jar:4.1.35.Final]",
"at io.netty.channel.AbstractChannelHandlerContext.write(AbstractChannelHandlerContext.java:805) [netty-transport-4.1.35.Final.jar:4.1.35.Final]",
"at io.netty.channel.AbstractChannelHandlerContext.writeAndFlush(AbstractChannelHandlerContext.java:762) [netty-transport-4.1.35.Final.jar:4.1.35.Final]",
"at io.netty.channel.DefaultChannelPipeline.writeAndFlush(DefaultChannelPipeline.java:1031) [netty-transport-4.1.35.Final.jar:4.1.35.Final]",
"at io.netty.channel.AbstractChannel.writeAndFlush(AbstractChannel.java:310) [netty-transport-4.1.35.Final.jar:4.1.35.Final]",
"at org.elasticsearch.http.netty4.Netty4HttpChannel.sendResponse(Netty4HttpChannel.java:43) [transport-netty4-client-7.2.0.jar:7.2.0]",
"at org.elasticsearch.http.DefaultRestChannel.sendResponse(DefaultRestChannel.java:123) [elasticsearch-7.2.0.jar:7.2.0]",
"at org.elasticsearch.rest.RestController$ResourceHandlingHttpChannel.sendResponse(RestController.java:498) [elasticsearch-7.2.0.jar:7.2.0]",
"at org.elasticsearch.rest.action.RestResponseListener.processResponse(RestResponseListener.java:37) [elasticsearch-7.2.0.jar:7.2.0]",
"at org.elasticsearch.rest.action.RestActionListener.onResponse(RestActionListener.java:47) [elasticsearch-7.2.0.jar:7.2.0]",
"at org.elasticsearch.action.support.TransportAction$1.onResponse(TransportAction.java:68) [elasticsearch-7.2.0.jar:7.2.0]",
"at org.elasticsearch.action.support.TransportAction$1.onResponse(TransportAction.java:64) [elasticsearch-7.2.0.jar:7.2.0]",
"at org.elasticsearch.action.search.AbstractSearchAsyncAction.onResponse(AbstractSearchAsyncAction.java:316) [elasticsearch-7.2.0.jar:7.2.0]",
"at org.elasticsearch.action.search.AbstractSearchAsyncAction.onResponse(AbstractSearchAsyncAction.java:51) [elasticsearch-7.2.0.jar:7.2.0]",
"at org.elasticsearch.action.search.FetchSearchPhase$3.run(FetchSearchPhase.java:213) [elasticsearch-7.2.0.jar:7.2.0]",
"at org.elasticsearch.action.search.AbstractSearchAsyncAction.executePhase(AbstractSearchAsyncAction.java:166) [elasticsearch-7.2.0.jar:7.2.0]",
"at org.elasticsearch.action.search.AbstractSearchAsyncAction.executeNextPhase(AbstractSearchAsyncAction.java:159) [elasticsearch-7.2.0.jar:7.2.0]",
"at org.elasticsearch.action.search.ExpandSearchPhase.run(ExpandSearchPhase.java:120) [elasticsearch-7.2.0.jar:7.2.0]",
"at org.elasticsearch.action.search.AbstractSearchAsyncAction.executePhase(AbstractSearchAsyncAction.java:166) [elasticsearch-7.2.0.jar:7.2.0]",
"at org.elasticsearch.action.search.AbstractSearchAsyncAction.executeNextPhase(AbstractSearchAsyncAction.java:159) [elasticsearch-7.2.0.jar:7.2.0]",
"at org.elasticsearch.action.search.FetchSearchPhase.moveToNextPhase(FetchSearchPhase.java:206) [elasticsearch-7.2.0.jar:7.2.0]",
"at org.elasticsearch.action.search.FetchSearchPhase.lambda$innerRun$2(FetchSearchPhase.java:104) [elasticsearch-7.2.0.jar:7.2.0]",
"at org.elasticsearch.action.search.CountedCollector.countDown(CountedCollector.java:53) [elasticsearch-7.2.0.jar:7.2.0]",
"at org.elasticsearch.action.search.CountedCollector.onResult(CountedCollector.java:64) [elasticsearch-7.2.0.jar:7.2.0]",
"at org.elasticsearch.action.search.FetchSearchPhase$2.innerOnResponse(FetchSearchPhase.java:166) [elasticsearch-7.2.0.jar:7.2.0]",
"at org.elasticsearch.action.search.FetchSearchPhase$2.innerOnResponse(FetchSearchPhase.java:163) [elasticsearch-7.2.0.jar:7.2.0]",
"at org.elasticsearch.action.search.SearchActionListener.onResponse(SearchActionListener.java:45) [elasticsearch-7.2.0.jar:7.2.0]",
"at org.elasticsearch.action.search.SearchActionListener.onResponse(SearchActionListener.java:29) [elasticsearch-7.2.0.jar:7.2.0]",
"at org.elasticsearch.action.ActionListenerResponseHandler.handleResponse(ActionListenerResponseHandler.java:54) [elasticsearch-7.2.0.jar:7.2.0]",
"at org.elasticsearch.action.search.SearchTransportService$ConnectionCountingHandler.handleResponse(SearchTransportService.java:432) [elasticsearch-7.2.0.jar:7.2.0]",
"at org.elasticsearch.transport.TransportService$ContextRestoreResponseHandler.handleResponse(TransportService.java:1101) [elasticsearch-7.2.0.jar:7.2.0]",
"at org.elasticsearch.transport.TransportService$DirectResponseChannel.processResponse(TransportService.java:1182) [elasticsearch-7.2.0.jar:7.2.0]",
"at org.elasticsearch.transport.TransportService$DirectResponseChannel.sendResponse(TransportService.java:1162) [elasticsearch-7.2.0.jar:7.2.0]",
"at org.elasticsearch.transport.TaskTransportChannel.sendResponse(TaskTransportChannel.java:54) [elasticsearch-7.2.0.jar:7.2.0]",
"at org.elasticsearch.action.support.ChannelActionListener.onResponse(ChannelActionListener.java:47) [elasticsearch-7.2.0.jar:7.2.0]",
"at org.elasticsearch.action.support.ChannelActionListener.onResponse(ChannelActionListener.java:30) [elasticsearch-7.2.0.jar:7.2.0]",
"at org.elasticsearch.search.SearchService$1.doRun(SearchService.java:347) [elasticsearch-7.2.0.jar:7.2.0]",
"at org.elasticsearch.common.util.concurrent.AbstractRunnable.run(AbstractRunnable.java:37) [elasticsearch-7.2.0.jar:7.2.0]",
"at org.elasticsearch.common.util.concurrent.TimedRunnable.doRun(TimedRunnable.java:44) [elasticsearch-7.2.0.jar:7.2.0]",
"at org.elasticsearch.common.util.concurrent.ThreadContext$ContextPreservingAbstractRunnable.doRun(ThreadContext.java:758) [elasticsearch-7.2.0.jar:7.2.0]",
"at org.elasticsearch.common.util.concurrent.AbstractRunnable.run(AbstractRunnable.java:37) [elasticsearch-7.2.0.jar:7.2.0]",
"at java.util.concurrent.ThreadPoolExecutor.runWorker(ThreadPoolExecutor.java:1128) [?:?]",
"at java.util.concurrent.ThreadPoolExecutor$Worker.run(ThreadPoolExecutor.java:628) [?:?]",
"at java.lang.Thread.run(Thread.java:835) [?:?]"] }
{"type": "server", "timestamp": "2019-07-30T14:52:31,517+0000", "level": "INFO", "component": "o.e.n.Node", "cluster.name": "docker-cluster", "node.name": "40a5dff89f7f", "cluster.uuid": "ErXDUGkORl--NnJwiYFINw", "node.id": "WmLyycgDR32y1ULuaD1npw",  "message": "stopped"  }
{"type": "server", "timestamp": "2019-07-30T14:52:31,518+0000", "level": "INFO", "component": "o.e.n.Node", "cluster.name": "docker-cluster", "node.name": "40a5dff89f7f", "cluster.uuid": "ErXDUGkORl--NnJwiYFINw", "node.id": "WmLyycgDR32y1ULuaD1npw",  "message": "closing ..."  }
{"type": "server", "timestamp": "2019-07-30T14:52:32,115+0000", "level": "INFO", "component": "o.e.n.Node", "cluster.name": "docker-cluster", "node.name": "40a5dff89f7f", "cluster.uuid": "ErXDUGkORl--NnJwiYFINw", "node.id": "WmLyycgDR32y1ULuaD1npw",  "message": "closed"  }

I also double checked that Elasticsearch expects a SIGTERM for a graceful shutdown and it does.

Hi @Crazybus, any updates on this issue? maybe should I open issue in elasticsearch repo directly?

Since you discovered it I will let you have the honour of opening it in the Elasticsearch repo. I'm more than happy to do it for you though if you don't have the time. In any case please make sure to link back to this issue to give them some more context.

Crazybus commented 5 years ago

Thank you for following through and opening the issue in the Elasticsearch repo :). I'm going to close this issue now since the lifecycle hooks feature was implemented (thanks again for that!).