elasticmachine
commented
1 week ago
elasticmachine
commented
1 week ago Pinging @elastic/obs-ux-infra_services-team (Team:obs-ux-infra_services)
Closed rockdaboot closed 1 week ago
elasticmachine
commented
1 week ago Pinging @elastic/obs-ux-infra_services-team (Team:obs-ux-infra_services)
 rockdaboot
commented
1 week ago
rockdaboot
commented
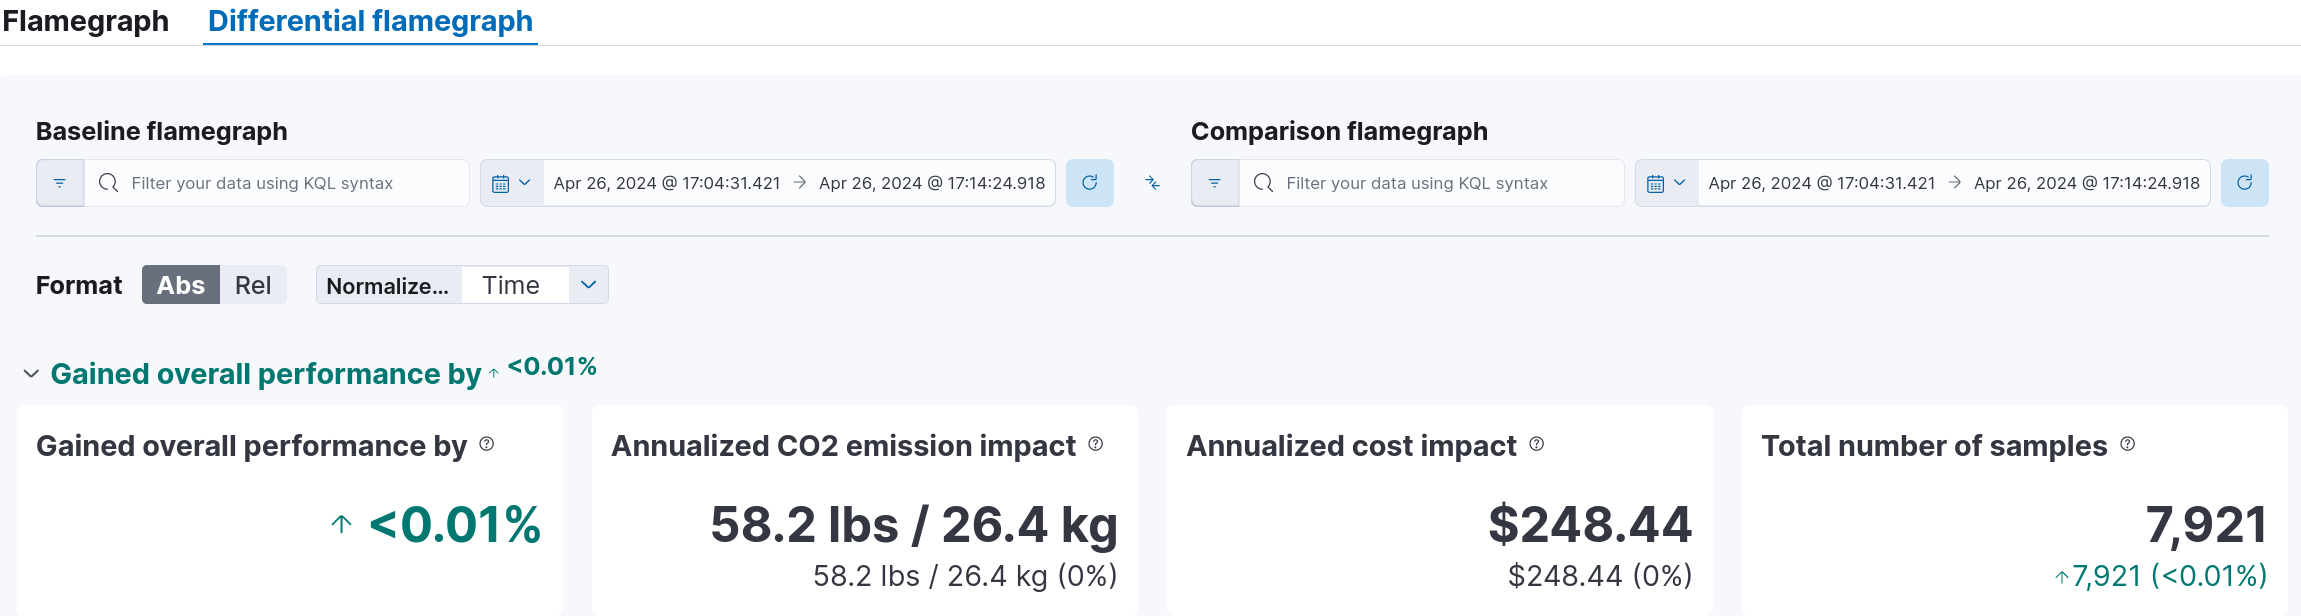
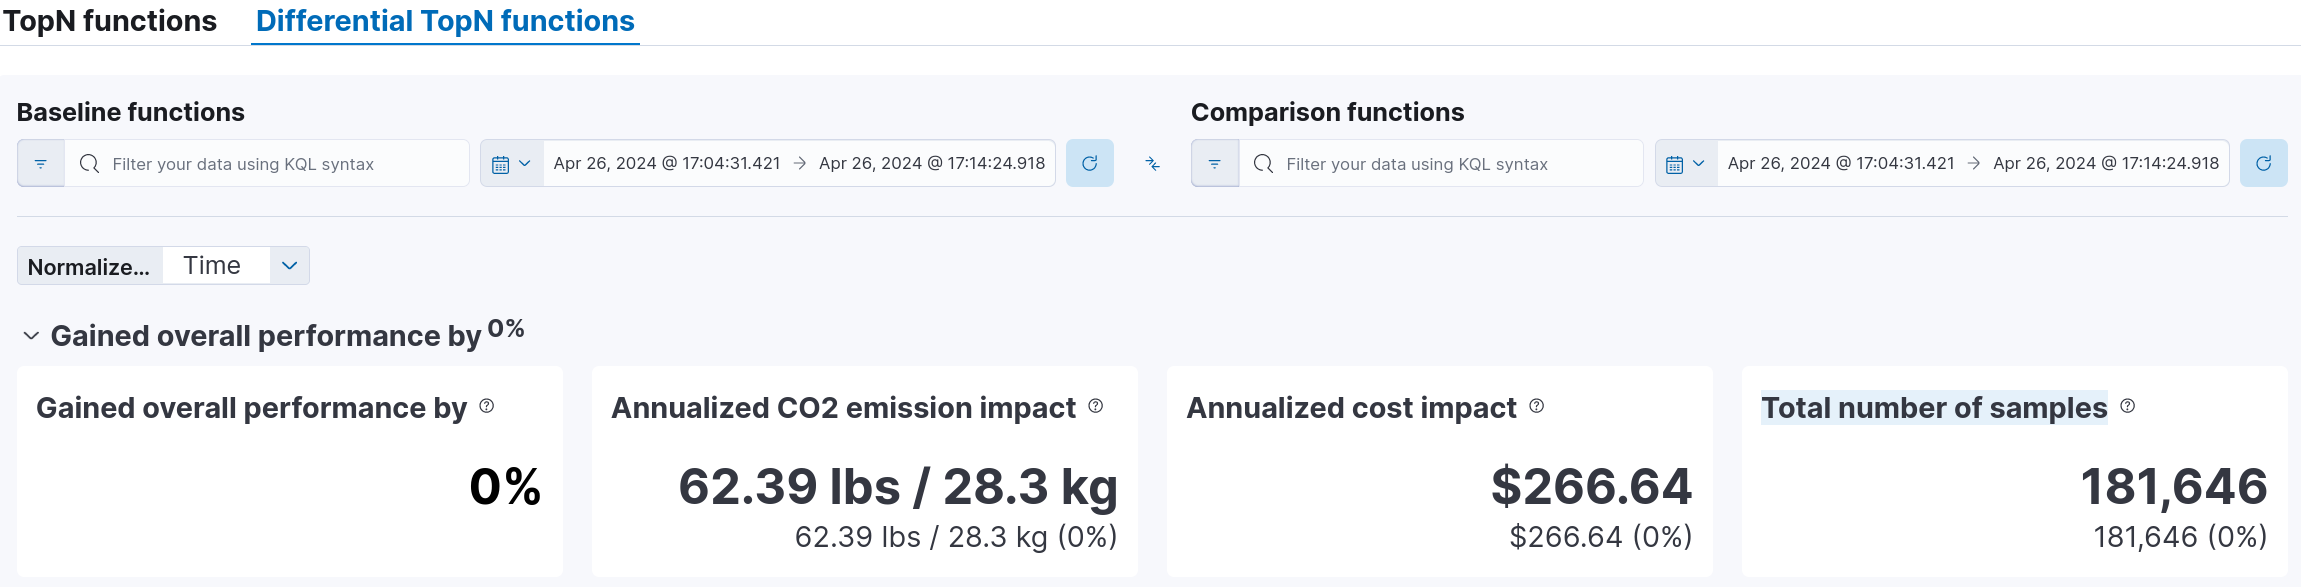
1 week ago Just seeing that there is also a little "glitch" in the first screenshot where 0 changes lead to a green arrow up and < 0.01%. It should just be zero without arrow, as seen in the second screenshot.
rockdaboot
commented
1 week ago ~I verified the shown values are delivered by the ES profiling API.~ My mistake, used the data from Kibana server. cc: @danielmitterdorfer
rockdaboot
commented
1 week ago @cauemarcondes The following needs to be changed:
diff. topN functions - "Total number of samples"
selfCPU from the Kibana server response, or even better: self_count from the ES response and avoid renaming fields on the Kibana server side. There is no need or use for total_count, TotalCount or totalCPU (IMO these fields can be dropped).diff. topN functions - "Annualized CO2 / costs"
self_annual_co2_tons and self_annual_cost_usd from the ES response.
Kibana version: 8.14-SNAPSHOT
Elasticsearch version: 8.14-SNAPSHOT
Describe the bug: The summary fields in the differential views for TopN Functions and Flamegraph should show the same values when calculated from the same data. But they don't.
Steps to reproduce:
Expected behavior: The summary fields in the differential views should show exactly the same data when based on the same data.
Screenshots (if relevant):