 elasticmachine
commented
1 week ago
elasticmachine
commented
1 week ago Pinging @elastic/security-detections-response (Team:Detections and Resp)
Open jpdjere opened 1 week ago
elasticmachine
commented
1 week ago Pinging @elastic/security-detections-response (Team:Detections and Resp)
elasticmachine
commented
1 week ago Pinging @elastic/security-solution (Team: SecuritySolution)
elasticmachine
commented
1 week ago Pinging @elastic/security-detection-rule-management (Team:Detection Rule Management)
 joepeeples
commented
1 week ago
joepeeples
commented
1 week ago If we end up merging this PR with the API validation for 1000 being the max value for max_signals, we'll have to revisit the docs that are being added in this PR, which explains that values higher than 1000 will be ignored by Kibana, which will only generate a maximum of 1000 alerts.
@jpdjere Does this mean that 1000 would become a hard-coded limit, regardless of the value of the global config setting xpack.alerting.rules.run.alerts.max? The docs PR just uses 1000 as an example, as the actual limit could be whatever the global config setting is. But if your PR adds a new hard-coded limit we'd definitely need to explain that differently in docs.
Also would it be possible to tweak the error messages in the images above? We don't really use the name max_signals or signals in the UI, so users might not immediately connect it with the UI setting Max alerts per run. They might also not immediately get what 1000 (400) is supposed to mean. So maybe something like:
Max alerts per run: Value must be less than or equal to 1000. (Error code 400) dplumlee
commented
1 week ago
dplumlee
commented
1 week ago Re: the 1000 limit via API validation - is it definitely the case that users can't set xpack.alerting.rules.run.alerts.max greater than 1000?
 jpdjere
commented
1 week ago
jpdjere
commented
1 week ago @dplumlee @banderror @joepeeples
I had misunderstood the behaviour of Kibana: I thought that 1000 was a hard limit in the rule executors, which overrided both the rule's value and the Kibana config. I understand now that it's just the default Kibana config and that the config can be set to a value higher than that.
Given the feedback here, I'll discard setting the validation on the API schema layer.
Do I get it right that even if we don't merge this PR, in the default Kibana configuration where xpack.alerting.rules.run.alerts.max == 1000 all these rules, including the Endpoint Security one, will be executing with warnings?
I'll give this a try with an actual prebuilt rule.
There shouldn't be a max limit at the schema level, we should calculate the final value of max_signals to use in rule executors.
@banderror
So you think we should limit the max value of max_signals on the rule executors? That is, if we have the scenario where for the value for max_signals is:
then calculated value in the rule executor should be 1000? Knowing now that there are Prebuilt Rules with a max_signals of 10,000, this doesn't look very clean now.
dplumlee
commented
1 week ago So you think we should limit the max value of max_signals on the rule executors? That is, if we have the scenario where for the value for max_signals is:
rule value: 50 Kibana config: 5000 then calculated value in the rule executor should be 1000? Knowing now that there are Prebuilt Rules with a max_signals of 10,000, this doesn't look very clean now.
@jpdjere I think he's saying we already calculate the effective "max signals" during rule execution from logic added in the previous PR. Right now we take the minimum of max_signals and xpack.alerting.rules.run.alerts.max and write a warning if it doesn't use the rule's own max_signals value. So for this case, we'd write a maximum of 50 alerts with no warning thrown.
jpdjere
commented
1 week ago Thanks @dplumlee!
Do I get it right that even if we don't merge this PR, in the default Kibana configuration where xpack.alerting.rules.run.alerts.max == 1000 all these rules, including the Endpoint Security one, will be executing with warnings?
First, as soon as I install a rule with a default max_signals of 10,000 in its security-asset (like Ransomware - Detected - Elastic Endgame), in a Kibana instance with the default config (so that the config defaults to 1000) the warning is shown: The rule's max alerts per run setting (10000) is greater than the Kibana alerting limit (1000). The rule will only write a maximum of 1000 alerts per rule run.
Second, I indexed 10,000 documents to force the rule to create that amount of alerts, but I got an unexpected result: it indexed only 100 rules (not 1,000 and not 10,000). I did it two times, and each time it created 100 alerts:
See the 201 alerts indicator at the top of the table (the extra one is just me testing via Dev Tools)
I'll delve a little deeper to understand what's going on here.
 banderror
commented
1 week ago
banderror
commented
1 week ago I'll delve a little deeper to understand what's going on here.
Thank you @jpdjere!
So you think we should limit the max value of max_signals on the rule executors? That is, if we have the scenario where for the value for max_signals is:
rule value: 50 Kibana config: 5000 then calculated value in the rule executor should be 1000? Knowing now that there are Prebuilt Rules with a max_signals of > 10,000, this doesn't look very clean now.
I meant what Davis says in https://github.com/elastic/kibana/pull/182643#issuecomment-2098849236. For a 10k example it should be:
rule value: 10000 Kibana config: 1000 then calculated value in the rule executor should be 1000
jpdjere
commented
1 week ago Ok, so, interesting discovery about the amount of alerts that are actually created. As I mentioned in this comment I have been testing the Ransomware - Detected - Elastic Endgame prebuilt rule, that comes with 10,000 as value for max_signals out of the box.
With the current behaviour of the app, the amount of alerts that we thought should be created is 1,000, which is the default value of the xpack.alerting.rules.run.alerts.max Kibana config. So I tried indexing 10,000 documents that should cause the rule to generate 10,000 alerts, but only see a maximum of 100 alerts generated each time. Both checking the index via the Dev Tools and of course the UI as well confirm this.
Digging into the code I found out:
1. In createSecurityRuleTypeWrapper we create searchAfterSize, the min between the calculated max_signals value and the constant DEFAULT_SEARCH_AFTER_PAGE_SIZE, which is 100.
That is passed over to the rule executor:
2. In the query executor, the searchAfterSize is passed as the pageSize option to searchAfterAndBulkCreate method, which is called when there is no alert suppression configured:
3. The method searchAfterAndBulkCreate calls searchAfterAndBulkCreateFactory, which in turn calls singleSearchAfter passing the pageSize (in our example, still 100):
searchResult is merged into mergedSearchResults, and then used to calculate includedEvents:
The problem that I see here is that what is passed to filterEventsAgainstList is mergedSearchResults.hits.hits, which has a maximum size of 100, the pageSize. The rest of the events seem to be "discarded":
In the screenshot above, you can see that mergedSearchResults.hits.hits has a size of 100, while the total amount of events indexed is 148 (the number I was trying while debugging).
4. Back in searchAfterAndBulkCreate, the bulkCreateExecutor is created and those 100 docs passed to the bulkCreate method. The second argument of that method is maxAlerts which uses the value of maxSignals to calculate it. But by this time, we have less documents than the limit, so it doesn't really matter. 100 alerts are created
I'm trying to understand if this is by design or I bumped into a bug here. Maybe @marshallmain or @vitaliidm or someone else from Detection Engine team can guide us here.
It looks from the code above that any value of maxSignals over 100 doesn't really matter cause it gets "overriden" by the page size. It doesn't feel it should be this way for us.
cc @dplumlee @banderror
 marshallmain
commented
1 week ago
marshallmain
commented
1 week ago @jpdjere We have an API integration test that tries to ensure that max_signals values greater than 100 are respected, can you verify if that test is working on this branch?
It's expected that a maximum of 100 alerts would be created on the first iteration of the loop in searchAfterAndBulkCreateFactory, but if the number of alerts created is less than max_signals it should continue searching for more pages. There's a known bug where if many documents have identical timestamps then the paging does not work correctly and less alerts are created than you would expect. How are you creating the source documents for testing?
jpdjere
commented
1 week ago @marshallmain Thanks for your reply. Yes, indeed that bug was the issue. I was running a script to index my docs and all had identical timestamps, randomizing their secs and milisecs did the trick.
So I guess that leaves us back with the question of how we want to handle this issue. @banderror's three alternatives:
Either override the system's max limit with the rule's max_signals, for these rules. This could be done via an additional rule parameter max_signals_force: boolean and an additional checkbox in the UI. (not sure that it's a good idea). Or not generate a Warning status if max_signals > xpack.alerting.rules.run.alerts.max AND it's a prebuilt rule. (looks like a good tradeoff to me). Or maybe set the max_signals value for those 18 rules to 1000, if the TRaDE team would be ok with that. (might be not an option if the goal is to promote as many external alerts as possible and let users increase the xpack.alerting.rules.run.alerts.max setting for that).
are probably a good starting point to resume the conversation with the TRaDE team and Product in the next Simplified Protections meeting next week.
I will revert this PR back to draft since the changes are not what we want, keeping it open because of the discussion.
Follow up to: https://github.com/elastic/kibana/pull/179680
Summary
max_signalsas editable field. https://github.com/elastic/kibana/pull/179680Changes
max_signalsto 1000 via Zod validation. This aligns the API contract with Kibana's behaviour: even if a user setsmax_signalsto a value over 1000, only a maximum of 1000 alerts are generated. This change aligns the contract with the actual behaviour.[request body]prefix.Before:
After: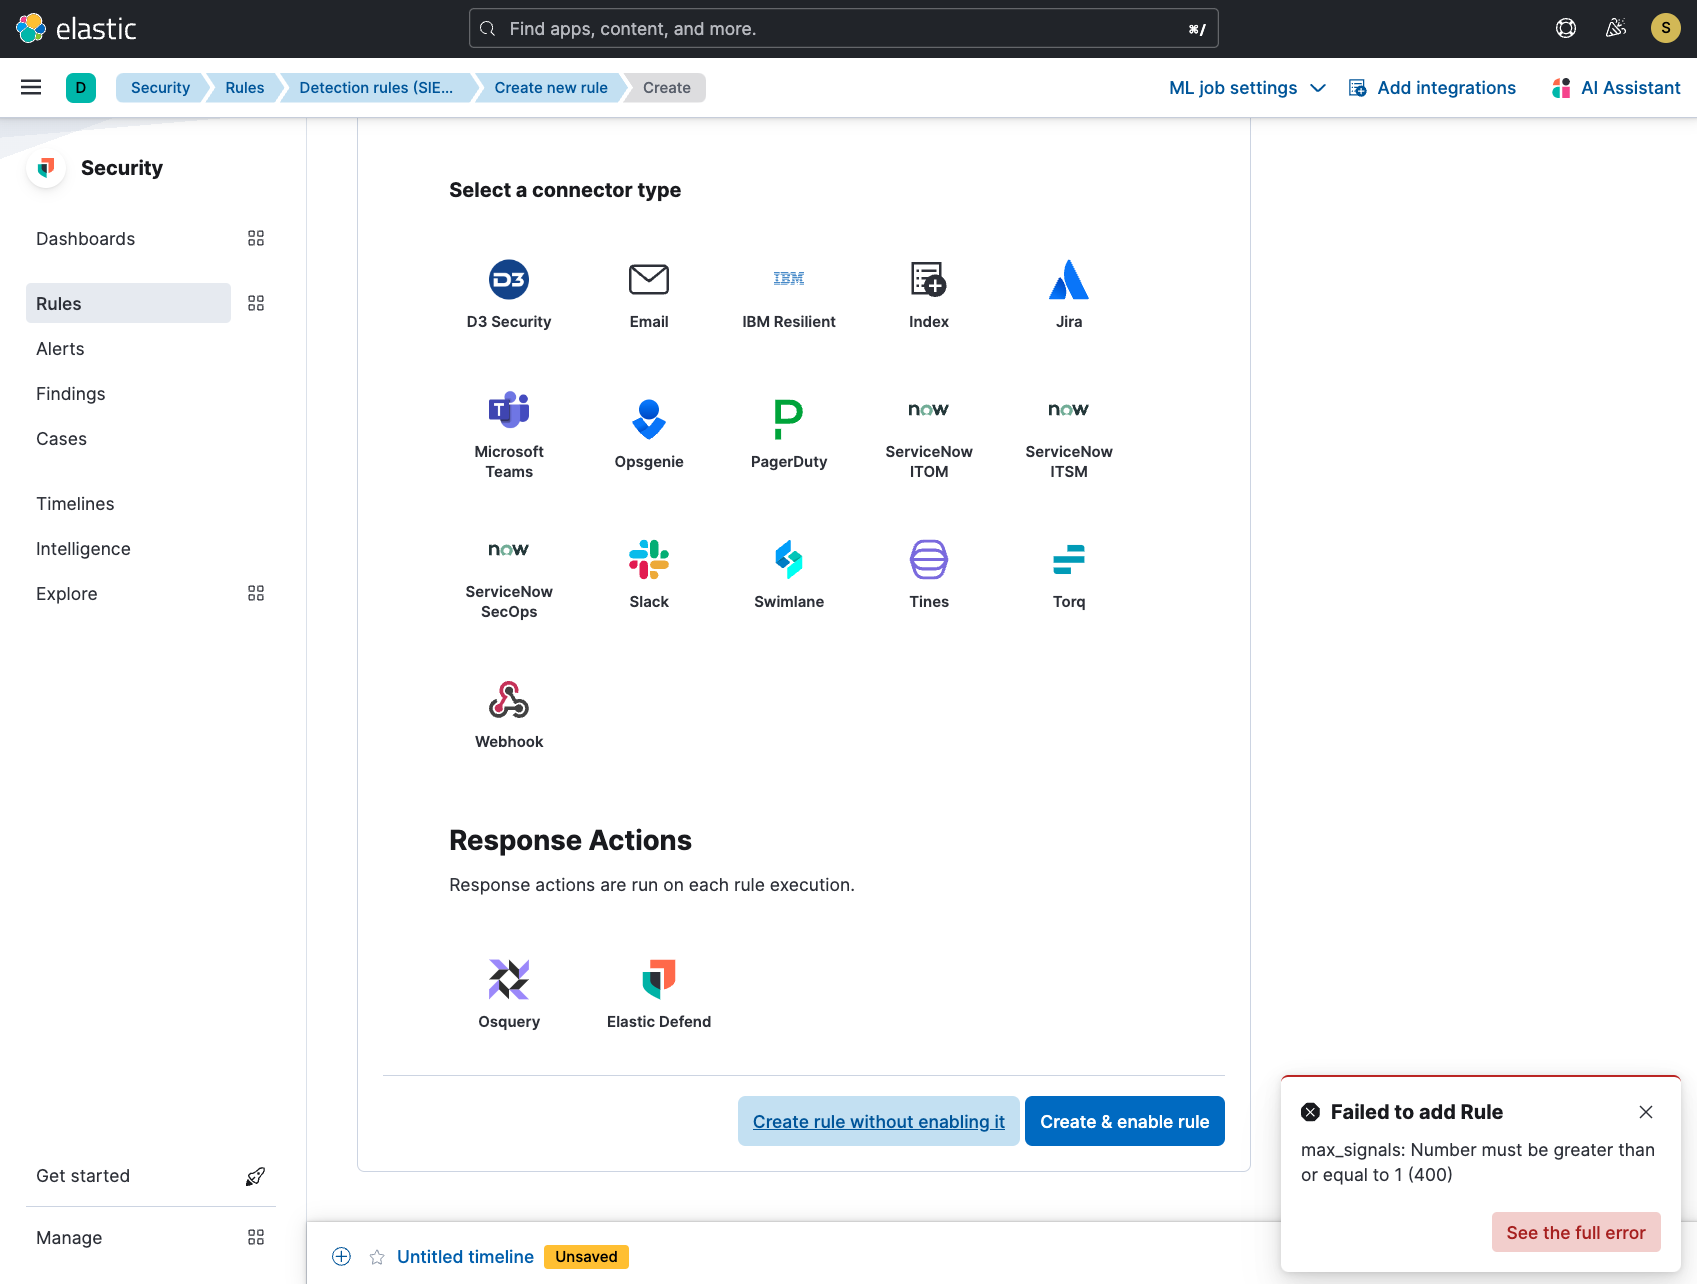
Docs note
FYI @joepeeples
If we en up merging this PR with the API validation for 1000 being the max value for
max_signals, we'll have to revisit the docs that are being added in this PR, which explains that values higher than 1000 will be ignored by Kibana, which will only generate a maximum of 1000 alerts.Checklist
Delete any items that are not applicable to this PR.
For maintainers