electricitymaps / electricitymaps-contrib

A real-time visualisation of the CO2 emissions of electricity consumption
https://app.electricitymaps.com
GNU Affero General Public License v3.0
3.48k stars 925 forks source link

MISO data for USA #983

Closed systemcatch closed 5 years ago

systemcatch commented 6 years ago

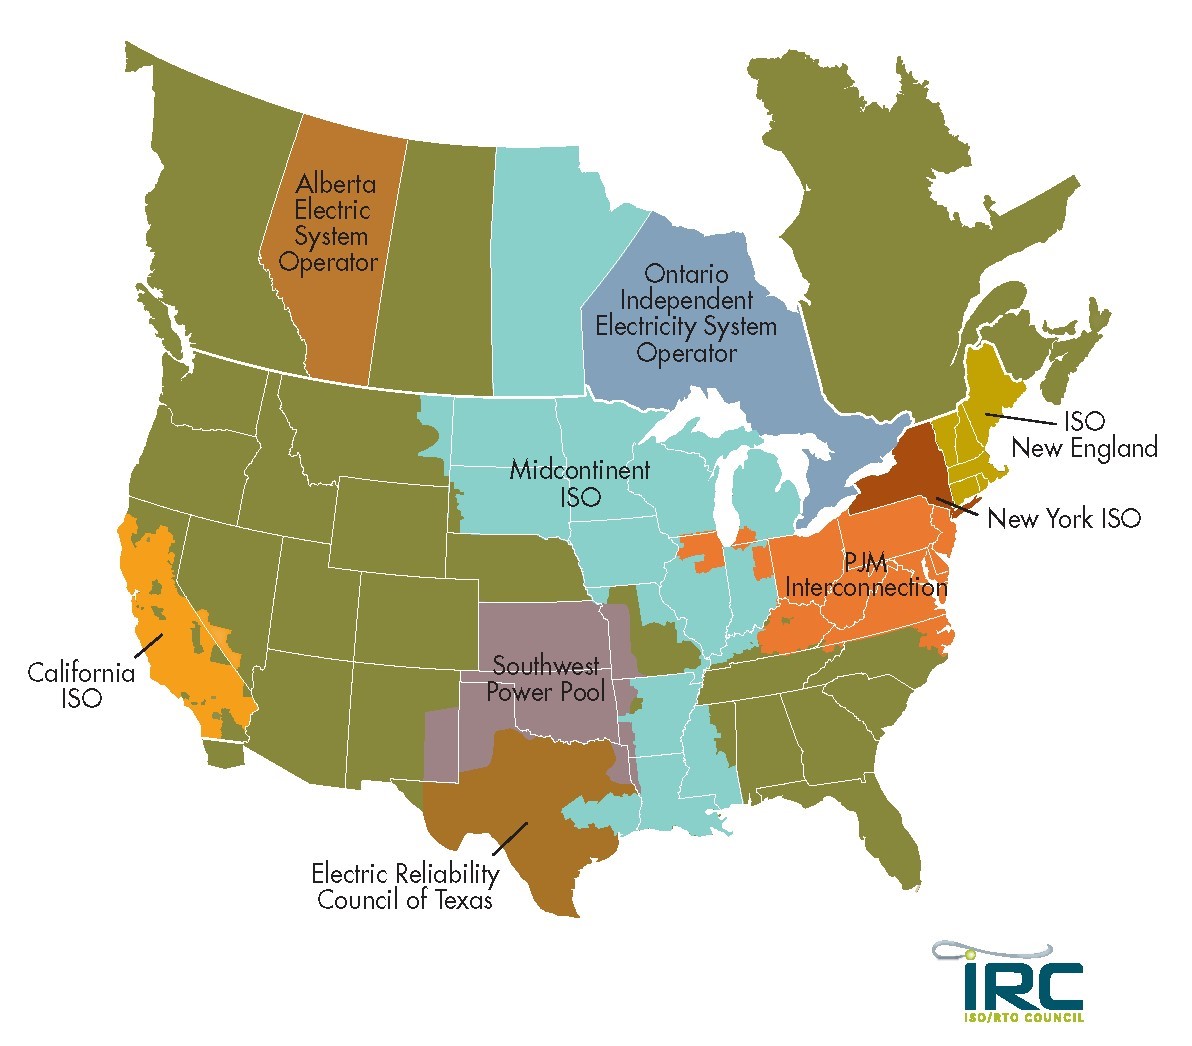
There is fuel mix data for the MISO Regional Transmission Organization at https://www.misoenergy.org/MarketsOperations/RealTimeMarketData/Pages/FuelMix.aspx

It's updated every 5 minutes but I haven't found a way to get past data yet. There is breakdown by type which is good enough for our purposes.

MISO covers a large chunk of the USA and possibly one of the states in Canada (Manitoba). miso

HansHyde commented 6 years ago

I could help you sort this. But I have a whole cluster#### in my repo including NY, PJM & HQ I can't clear. Thinking to delete my entire EM repo, as I have json & py files saved in separate repos, then rebuild.

If you could create a "template" Parser for each PJM.py, MISO.py & TVA.py (with PRs for each) and add to the EM repo (or share your own) I can add notes within to steer the way.

jarek commented 6 years ago

I don't think this particular data includes Manitoba - the current reported production of hydro is no more than 701 MW (current "Other" production), whereas Manitoba runs around 2-4 GW of hydro (StatCan Table 127-0002 historical data 2008-2015 reports monthly production between 2,001,069 and 3,291,048 MWh).

systemcatch commented 6 years ago

@jarek ah ok clearly then this doesn't include Manitoba, kind of surprised they put hydro in the 'other' category along with all sorts of other generation.

jarek commented 6 years ago

It looks like Manitoba is sort-of-MISO-member? E.g. https://www.misoenergy.org/LMPContourMap/MISO_All.html with Flash enabled shows that Manitoba is not part of planning or reserve zones.

One possible thing: that LMP contour map also shows Manitoba cut at around 52 degrees latitude (and only one generator/generating centre there). Something like 80% of Manitoba's population and presumably demand/network management is south of 51 degrees latitude, but the large hydro installations are up north (Wikipedia list) - the installed hydro capacity south of 54 degrees latitude is only 600 MW. So maybe Manitoba's north is not part of MISO balancing pools somehow?

Right now https://www.misoenergy.org/MarketsOperations/RealTimeMarketData/Pages/NetScheduledInterchange.aspx shows exports to MHEB (which used to stand for Manitoba Hydro Electric Board, and might still be getting used?), up to 700 MW, though it was 300 MW imports Friday evening. Manitoba Hydro says they use more electricity in the winter, and export in the summer; plus hydro is dispatchable so they can spin it down on the weekend. I would like to see the interchange data over longer periods of time, but this could be about right for MISO<->Manitoba interchange.

HansHyde commented 6 years ago

@jarek - Manitoba is indeed within MISO. What you are trying to decipher is explainable by long HVDC transmission lines, which both Manitoba & Quebec have plenty of.

Manitoba may report realtime data for its own purposes as a province, but it still is within the MISO electric balancing association. How Electricity Maps splits it is another story.

@systemcatch

Here's an overview of exchanges (external) and intra-MISO to be aware of. They may be more than 1 line/data stream (as was the case with NEISO/NYISO) ...

miso - interconnections overview

The dark green ovals will be DC interconnections to the Western Interconnection.

I have a suspicion Entergy may not report (or report separately) from MISO. Entergy territory is all the lower area below the bottleneck of MISO.

jarek commented 6 years ago

@HansHyde Ah okay thanks. So does HVDC confirm my guess that Manitoba generation is not part of that MISO fuel mix report page?

HansHyde commented 6 years ago

@jarek that I cannot say. If we want to make an absolute confirmation, we will need to trace back transmission lines, substations & switchyards via satellite imagery like Google Earth to create a macro-level circuit diagram.

Not to get off-topic, but there is a connection between a "macro-level circuit diagram" of the grid (more detailed than that I have simplified above for the Eastern Interconnection above) and data that is reported/accessible to us, such as Node Prices visible on CAISO (ISO Today App), which covers the entire Western Electricity Imbalance Market - which Oli noted last week. This is where we will find answers for our Parsers & Exchanges in the Western US states & Canadian Provinces.

Higher level image - left side is CAISO Map with prices at Nodes, right side is GoogleEarth where I located the "Nodes" as a physical grid asset (Nodes are substations - connection points to generators (GEN) or distribution circuits (LOAD), or they are switchyards (distribution hubs for transmission lines).

weim - caiso_nodes - physical_electricgrid_assets

Closer level image - left is CAISO Map with Node information, right is a GEN substation (actual) that corresponds to the Node. To see the substation, I had to zoom in. What you can't see is the windfarm north & south of the substation, which uses transformers to "step-up" the windfarm voltage to transmission voltage.

weim - moonshine substation - connection point to windfarm

When it comes to MISO, we will likely find a HVDC line coming from "within" SwPP directly connecting to MISO (or possible PJM-Illinois). If it reports Generation on SwPP or MISO will be the question we have to answer correctly; 1) does the generation source at the HVDC origin go in generation for SwPP and show as an exchange from SwPP Parser, or 2) does the generation source at the HVDC origin go in the MISO Parser without an exchange from SwPP. I suspect Manitoba HVDC will present similar questions to be answered.

corradio commented 6 years ago

There's a better API here: https://api.misoenergy.org/MISORTWD/dashboard.html?fuelMix

systemcatch commented 6 years ago

Can someone have a look around https://www.misoenergy.org/ for their installed capacity. I've searched but can't find it yet.

alixunderplatz commented 6 years ago

@systemcatch not sure if this is it, but it's something: a corporate "fact" sheet: https://www.misoenergy.org/about/media-center/corporate-fact-sheet/

image

Maybe you can apply the percentages to the total generation capacity image

edit: hydro is missing ... 😞 will look for other stuff

sandeen commented 6 years ago

I have a boatload of past MISO data. It may not be 100% complete but I have years of 5 minute data from their fuel mix. If you can use it, let me know what format would be useful.

As for the live data source, I think what you want is https://api.misoenergy.org/MISORTWDDataBroker/DataBrokerServices.asmx?messageType=getfuelmix&returnType=csv (or =json or =xml, whatever works best; note that json will give you gzipped data)

systemcatch commented 6 years ago

Hi @sandeen that's pretty cool, have you been scraping the data yourself?

systemcatch commented 6 years ago

Found http://pubmanitoba.ca/v1/nfat/powerpoints/2_overview_miso_market.pdf that gives an indication of hydro capacity from 2012.

alixunderplatz commented 6 years ago

@systemcatch I think the market area has changed a lot over time since 2012, so this will have influenced the capacity. I think leaving hydro capacity blank is fine! Probably MISO don't know themselves, else they would have published it somewhere 😆 ... these strange ISO areas are a pure mess imo 😩 ...

sandeen commented 6 years ago

Yes I've been scraping it myself. ;) Let me know if it'd be useful.

systemcatch commented 6 years ago

Yes that would be very useful for our dataset, json format would be easiest to work with. If you want you can join us on slack and we can talk about the best way of incorporating it.

sandeen commented 6 years ago

Digging around some more - MISO is split into regions. Although the API above does not split them out, the daily spreadsheets (sigh) at i.e. https://old.misoenergy.org/Library/Repository/Market%20Reports/20180125_sr_gfm.xls do - and they also split out hydro. The downside is that they are hour resolution not 5 minute. That, and there seems to be no clear definition of where these regions lie. It's a pity, because Xcel, the primary utility in the north, is heavily invested in wind, but that gets swamped out by all the less progressive generation across the MISO territory in the top-line numbers. Yesterday the Northern region was 8% wind, but MISO was only 2% wind overall. It would be nice to get the more granular geography for this large region.

systemcatch commented 6 years ago

Things left to do;

corradio commented 6 years ago

@systemcatch price data in the US is tricky, as they often use nodal pricing. I'm fine closing this issue if/when we have integrated all exchanges. Can you put up a checklist of the exchanges that are missing?

systemcatch commented 6 years ago

Exchanges that are missing with regions we have data for;

Plus about 6 others that we have no data or areas in progress.

brunolajoie commented 5 years ago

Hi @sandeen ! We have now collected 1 year of data from the live parser, and are now interested in adding more historical MISO data to our database! Could you let us know what you found?

sandeen commented 5 years ago

Hi @brunolajoie - I thought I had already provided all the historical data I had. Did that never get integrated? I think I still have the tarball I prepared, let me know how I could provide it.

(Edit: Looking above, @systemcatch seems to have said that my data was already incorporated...) (Edit2: I haven't found a nice way to get any older data)

brunolajoie commented 5 years ago

Sorry if I forgot. We've got data since ~Feb 2018 in the database. Is that what you found? or did you get longer time series?

systemcatch commented 5 years ago

I remember cleaning up @sandeen's old data and sending it to @corradio, I think he said there was an issue open in the private repo for integrating it.

Looking through my computer I've got several xls files for MISO for 2013/14/15/16.

corradio commented 5 years ago

I remember inserting all the data that @systemcatch sent me!

On Fri, Feb 8, 2019 at 12:51 PM Chris notifications@github.com wrote:

I remember cleaning up @sandeen https://github.com/sandeen's old data and sending it to @corradio https://github.com/corradio, I think he said there was an issue open in the private repo for integrating it.

Looking through my computer I've got several xls files for MISO for 2013/14/15/16.

— You are receiving this because you were mentioned. Reply to this email directly, view it on GitHub https://github.com/tmrowco/electricitymap-contrib/issues/983#issuecomment-461779194, or mute the thread https://github.com/notifications/unsubscribe-auth/ABlEKLxEQ0GAM3MgiacjtsWKlHx_jWUKks5vLWS9gaJpZM4RVpLb .

--

www.tmrow.com +45 53 70 44 03

[image: Image result for linkedin] http://linkedin.com/in/oliviercorradi linkedin.com/in/oliviercorradi https://www.linkedin.com/in/oliviercorradi [image: Image result for twitter] @corradio https://twitter.com/corradio

sandeen commented 5 years ago

Ok - well, I think I still have the json files that I cobbled together, let me know if you want them again. It goes back to Dec 2013. If the json is a mess, I have it in other forms.

brunolajoie commented 5 years ago

Happy to discuss on slack (I've sent you a message)

systemcatch commented 5 years ago

Sent you the data again @brunolajoie

brunolajoie commented 5 years ago

The JSON that I received only contains data from Dec 13 to Jan 2014 (@sandeen @systemcatch). Let me know if you find data for the 2014-2017 period :) Thanks!

sandeen commented 5 years ago

http://sandeen.net/electricitymap/miso-pretty.json.bz2 is what I provided last year and has data thru Jan 2018 AFAIK.

systemcatch commented 5 years ago

@sandeen yup your data is fine I just need to fix my processing script.

amcolton commented 4 years ago

For the MISO, PJM, or SPP footprint does anyone have a good methodology for identifying the latitude and longitude of a price node, generation node, or transmission line? I am trying to aggregate this data and I have only been able to find historical list of nodes in PJM from 2014. There is a complete list on GitHub for CAISO. I have not found anything for SPP or MISO and I am working on tracking down individual generation companies but it has been a very slow process.

abbasrational commented 9 months ago

Hi Everyone, I'm working with the MISO energy LMP dataset for my Master's thesis, and I'm trying to find the Load (MW) data corresponding to the Locational Marginal Prices (LMPs). I've been searching extensively on the MISO website, but I haven't been able to locate relevant information. Could anyone provide guidance or assistance in finding this specific information within the dataset? Any help would be greatly appreciated!