 emitanaka
commented
1 year ago
emitanaka
commented
1 year ago Adding background geom is possible as it is a ggplot object but the main thing is that the information needs to be encoded by the user somewhere in the process. Row and column coordinates tend to be a natural part of the row-column designs so those are easy to show. Some visualisation are experimental diagrams (that explain the experimental process) rather than the experimental design layout. The former isn't really part of the plan since the process tends to be idiosyncratic.
Hi @emitanaka, there was a question at your Ihaka lecture at around 56:00 along the lines of "Can the software produce experiment specific layouts and instructions from the experimental design"? Examples given included field plots for planting experiments, or diagrams of "which part of a rat's lobe to randomly cut off."
Aside from replacing the geoms with images, another idea would be to use a background image (of the lab plate, or field layout) and attach coordinates to each experimental unit for plotting the treatment to apply to that experimental unit. You could think of it as a variation on georeferencing map images below (taken from Master GDAL Tools)--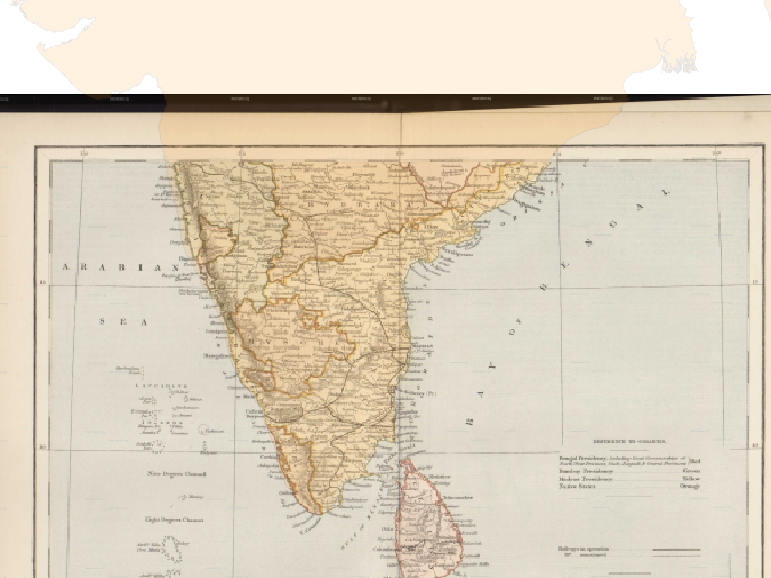
I don't have enough ggplot skills to try this out, but it seems in theory possible and seems more flexible than the row/col solution you mentioned at the lecture.