enthought / mayavi

3D visualization of scientific data in Python
http://docs.enthought.com/mayavi/mayavi/
Other
1.32k stars 286 forks source link

How to display complex functions with mayavi? #645

Closed brupelo closed 6 years ago

brupelo commented 6 years ago

Hi, I've got a little question:

Consider the complex function z1^n+z2^n=1, where z1=x+jy, z2=z+jw are complex number. Now, if we solve that equation for w when n=2 we'd get:

Now, I wonder how I can display those solutions on mayavi, at this point I've been able to use succesfully mlab.mesh and mlab.plot3d to display real functions... but with complex functions, not sure how to do it, could anyone please provide a little snippet to show how to do it?

The result should look like this

brupelo commented 6 years ago

@prabhuramachandran Hi, sorry to ping you but after checking the commit history it seems you're quite active on the mayavi coding... Maybe you got any useful advice for this one? The interest on this one started with this stackoverflow question but I didn't know how to answer it, that's why I've decided to ask it here in the first place :)

Thx in advance.

prabhuramachandran commented 6 years ago

@brupelo, no problem, how do you want to view the solution? From what I can see you have a complex field. Do you want to view the real part, the imaginary part or the magnitude or argument? Or do you want to view this as a vector field of the form u+ iv. For the former you can use the mlab.contour3d function to sample the field at a set of uniformly spaced points (use numpy.mgrid). Or use mlab.flow/mlab.quiver3d to view it as a vector field. See here: for some examples: http://docs.enthought.com/mayavi/mayavi/mlab.html#id1

brupelo commented 6 years ago

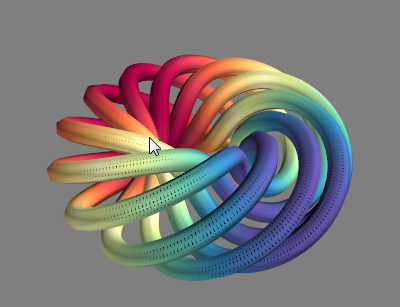
@prabhuramachandran It'd be nice to learn how to view all of them, real/imaginary/magnitude/argument... But for the time being, I'm just interested to figure out how to display z1^2+z2^2-1=0 exactly the same way like this

alt text

Correct me if I'm wrong but that picture seemed it was generated using plot3d? I know how to display real functions using that function, ie:

from mayavi import mlab
from mayavi.mlab import plot3d, mesh
import numpy
n_mer, n_long = 6, 11
pi = numpy.pi
dphi = pi / 1000.0
phi = numpy.arange(0.0, 2 * pi + 0.5 * dphi, dphi)
mu = phi * n_mer
x = numpy.cos(mu) * (1 + numpy.cos(n_long * mu / n_mer) * 0.5)
y = numpy.sin(mu) * (1 + numpy.cos(n_long * mu / n_mer) * 0.5)
z = numpy.sin(n_long * mu / n_mer) * 0.5

plot3d(x, y, z, numpy.sin(mu), tube_radius=0.1, colormap='Spectral', representation='wireframe')
mlab.show() 

Will generate:

alt text

But I don't know how to plug the complex function on the above snippet. Could you please show me how to do it?

Thanks.

prabhuramachandran commented 6 years ago

You can try this:

from mayavi import mlab
import numpy as np
s = slice(-1, 1, 10j)
x, y, z = np.mgrid[s, s, s]
f = 1j*z + np.sqrt(x**2 + 2j*x*y - y**2 - 1)
mlab.contour3d(x, y, z, f.real)
# Or this:
mlab.contour3d(x, y, z, f.imag)
# Or:
mlab.contour3d(x, y, z, np.abs(f))

Or you could slice through the data like so:

src = mlab.pipeline.scalar_field(x, y, z, np.abs(f))
scp = mlab.pipeline.scalar_cut_plane(src)

Or you could use a grid plane like so:

gp = mlab.pipeline.contour_grid_plane(src)
gp.enable_contours = False

I think this should give you enough ideas to visualize your data. I am closing this ticket as this is not an issue. For more questions, please post on one of the mailing lists.

brupelo commented 6 years ago

@prabhuramachandran Thanks for your help, I've tried all those attempts and for some reason I'll get this error on all of them:

alt text

Using mayavi 4.5.0 + python3.6.x + win7 over here, which version did you use over there?

prabhuramachandran commented 6 years ago

The latest, 4.6.0, you can pip install it.

brupelo commented 6 years ago

Ok, cool, all your examples will work fine with latest mayavi... but none of them will display the function like the above pictures, this is the one I've been interested with from the very beginning:

alt text

As that's a very helpful way to study complex functions and compare them with gpu rendered ones, if you attempt:

plot3d(x, y, z, f.real, tube_radius=0.1, colormap='Spectral', representation='wireframe')

I'll get:

Traceback (most recent call last):
  File "D:\sources\personal\python\pyframework\widgets\editor\tests\mayavi_non_interactive.py", line 52, in <module>
    plot3d(x, y, z, f.real, tube_radius=0.1, colormap='Spectral', representation='wireframe')
  File "d:\virtual_envs\py364_32\lib\site-packages\mayavi\tools\helper_functions.py", line 37, in the_function
    return pipeline(*args, **kwargs)
  File "d:\virtual_envs\py364_32\lib\site-packages\mayavi\tools\helper_functions.py", line 82, in __call__
    output = self.__call_internal__(*args, **kwargs)
  File "d:\virtual_envs\py364_32\lib\site-packages\mayavi\tools\helper_functions.py", line 567, in __call_internal__
    self.source = self._source_function(*args, **kwargs)
  File "d:\virtual_envs\py364_32\lib\site-packages\mayavi\tools\sources.py", line 1194, in line_source
    data_source.reset(x=x, y=y, z=z, scalars=s)
  File "d:\virtual_envs\py364_32\lib\site-packages\mayavi\tools\sources.py", line 478, in reset
    points.shape = (len(x), 3)
ValueError: cannot reshape array of size 3000 into shape (10,3)

Anyway, I understand you don't know how to achieve the above results, where would you recommend me to ask about this one then? The guy who asked on StackOverflow this very same question didn't get neither any answer, so...

Thanks in any case.

prabhuramachandran commented 6 years ago

@brupelo -- I think you need to first explain what the plot you have above is and not just show a picture. For example, you say: jz - sqrt(x**2 + 2jxy - y**2 - 1) is solution 1. Given this complex function, what are you trying to plot? Are you plotting a level set? Are you looking at the real value or the imaginary value or the absolute value? You have not provided any clarity on this and are expecting for someone else to do so by looking at a picture. Mayavi provides some basic primitives to visualize things but unless you have a clear idea of what you want to represent, you cannot show it. The problem with your picture is that it has no useful information, I don't see an axis, I don't see any range of values that the color represents? Basically, I do not know what you are asking or plotting. What is the basic shape that has been plotted? Are you just sampling the complex field on the given shape or is that shape representative of the solution?

Judging by what you just tried in the above, it appears you do not really understand what is going on with Mayavi and are just trying the commands to get something. This will not work. For example, did you read the basic mayavi documentation on mlab? Do you know that plot3d only accepts x, y, z coordinates to plot a line through the points? Do you know what contour3d does? So until you figure out what it is you are trying to plot I am afraid no one will be able to help you unless they have a better context of what is going on. Once you know what it is you are trying to plot you can use some plotting tool to create a plot but without that its like asking to recreate a photograph without knowing how to use a camera or having the objects to shoot at.

brupelo commented 6 years ago

@prabhuramachandran What you say makes sense and you're right but think about it in the first place. As I said at the very beginning this was a question (not mne) I didn't know how to answer, if I had a proper context about the problem I wouldn't have asked here in the first place. Take a look to this video, the guy who asked on Stackoverflow about this interesting question shared that video and he said he didn't have access to those python scripts... As you can see in the video, there is also a couple pdfs "complex curve visualisation.pdf" and "complex visualisation.pdf". I had asked the guy to share those docs but he didn't reply... I'm pretty sure this is just a simple assignment for university and probably those pdfs would be explaining how to achieve the results in the first place.

Anyway, you're the expert here so I assumed by showing you the pictures you'd immediately recognized which mayavi commands had been used... If I had more context about the problem of course I'd shared that in the first place but I don't.

NS: Gonna leave a comment to that guy on SO asking whether he finally solved the problem or not as I think this is a very interesting question and I'm quite intrigued :)

prabhuramachandran commented 6 years ago

@brupelo -- Sorry about that. I didn't realize it wasn't your question. Unfortunately, given my rather severe time constraints I am not in a position to figure out what the OP wants to do or experiment to find out. However, you may want to look at mlab.test_fancy_mesh and see how that is constructed.

brupelo commented 6 years ago

@prabhuramachandran I've found this mathematic answer to solve the exact same question... it's using mathematica but the plot looks quite similar to what we're looking for here. Do you know whether there is a direct port from mathematica to mayavi or they're just different beasts?

I'll take a look to test_fancy_mesh to see if I can find something there, thanks.