Wedds
commented
2 years ago
Wedds
commented
2 years ago Preview files layout
This section describes the proposal regarding the structure of files to be consumed by a previewer. Each sequence will be presented by a separate OME-TIFF file. OME-TIFF is a multi-paged TIFF image, it supports wells' structure and allows working with image channels.
Besides, some previewers support index files to be used with OME-TIFF for optimizing the load time of remote files (ex. viv).
Assuming, that raw HCS data is stored in s3://hcs-data/Measurement123 directory, following files should be generated:
├── Measurement123/                   // raw HCS
├── Measurement123.hcs                // previewer entrypoint, called an 'additional synthetic file' before
└── .hcsparser/
│   ├── Measurement123/
│   │   ├── 1/                        // sequence level
│   │   │   ├── data.ome.tiff         // sequence data
│   │   │   ├── data.offsets.json     // load-optimizing index
│   │   │   ├── wells_map.json        // navigation mapping
<ExperimentName>.hcs is a JSON file with the following schema:
{
    "sourceDir": "s3://hcs-data/Measurement123",
    "previewDir": "s3://hcs-data/.hcsparser/Measurement123",
    "plate_height": "8",
    "plate_width": "12",
    "time_series_details": { // map of (sequence: list<timepoints>) entries
        "1": ["1", "2"],
        "2": ["1", "2", "3"]
    }
}
wells_map.json is a 'navigation' mapping, which helps to call a suitable OME well/field according to the values, selected in the previewer. It is required since not all the wells (and their fields) contain meaningful info, besides, OME-TIFF elements have continuous 'flat' indexing instead of 2 coordinates.
- indices start from 1
- plane coordinates specification is a string of X, Y joined with an underscore.
{
    "2_2": {  // well (2;2) details
        "width": 12,
        "height": 12,
        "round_radius": 5.335, // radius from the center, informs whether the round line should be drawn; draw nothing in case `null` or missing
        "to_ome_wells_mapping": {
            "6_6": "ImageID:1",
            "6_7": "ImageID:2",
            "7_6": "ImageID:3",
            "7_7": "ImageID:4"
        }
    },
    ...
    "4_2": {
        "width": 12,
        "height": 12,
        "round_radius": 5.335,
        "to_ome_wells_mapping": {
            "7_6": "ImageID:23",
            "7_7": "ImageID:24"
        }
    },
    ...
    "7_3": {
        "width": 12,
        "height": 12,
        "round_radius": 5.335,
        "to_ome_wells_mapping": {
            "6_6": "ImageID:45",
            "6_7": "ImageID:46",
            "7_6": "ImageID:47",
            "7_7": "ImageID:48"
        }
    }
}
maryvictol
Background
In similar way as we've implemented the support of the "Patology images" previews in the Cloud-Pipeline, we should implement the support of previews of HCS images received by confocal microscopy methods.
Approach
For our issue, each HCS image represents a scope of raw
tiffimages and metadataxmlfile(s) united by one measurement. We shall implement the ability to preview that image bunches as united objects.Short description of HCS image in context of our issue:
fluorescence)Data structure
The minimal intended structure for the raw images data in the object data storage should be the following:
tiffraw image files corresponding to that measurementxmlformat ("Index.xml") created during the export of the raw data from the scanner.hcsextension (TBD)Open preview
There shall be the following ways to open a preview for the HCS images:
Preview pop-up
Preview pop-up shall contain:
In general case, the preview pop-up should look like the following: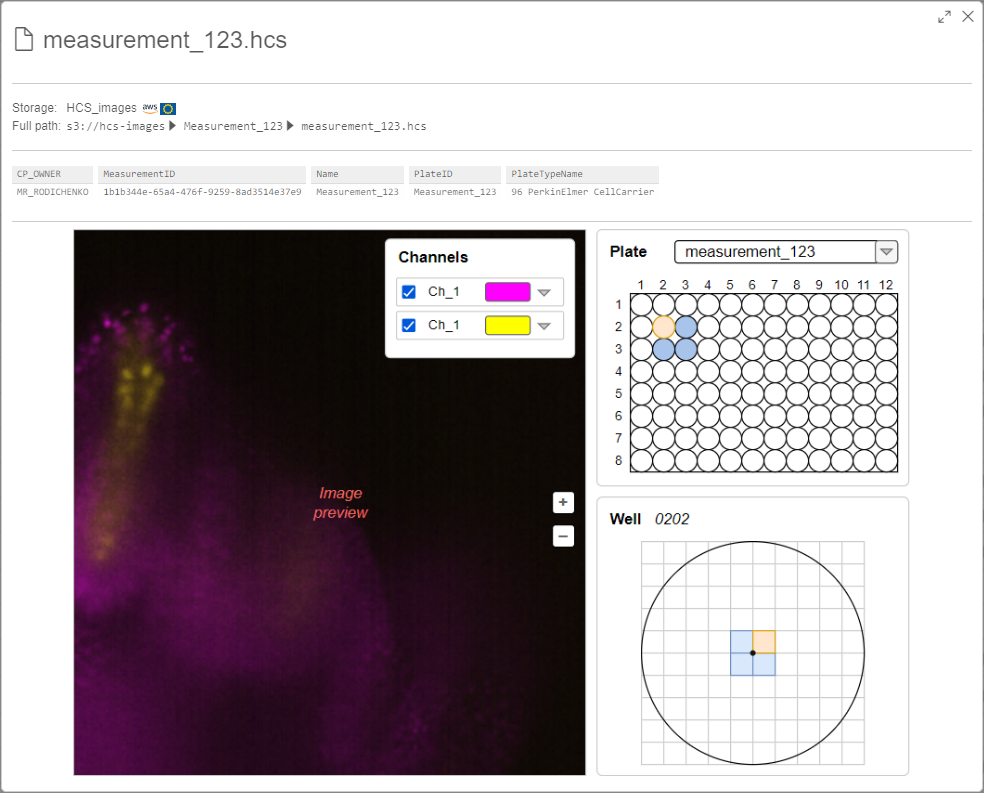
Plate panel
For each HCS measurement, there are one or several plates that include own bunches of images. Plates are defined inside the
<Plates>tag of theindex.xmlfile. At the Plate section, there should be:<PlateRows>(count of rows in this plate) and<PlateColumns>(count of columns in this plate) tags inside the<Plates>tag:<Well>inside the<Plates>tag<Well>tag - inside the<Wells>tag<Well>from inside the<Plates>tag should be selectedWell panel
This panel should include:
On the symbolic "map", should be shown:
Each well includes one or several field. An own raw set of
tifffiles corresponds to each field. So, the whole well image consists from all available fields.Field of the image can be defined by the tag
<FieldID>inside the<Image>tag. Position of the fields on the well image can be defined by tags<PositionX>and<PositionY>inside the<Image>tag.Channel panel
This panel shall include all channels list corresponds to the current plate. Total image in the image preview frame should be shown as additive blending of well images of the selected channels. By default, all channels should be selected. Full list of channels can be received from inside the
<Map>tags - entries withChannelIDoption.For each channel item at the Channel panel, there should be:
<ChannelName>tag inside the<Map>tag)Example of the image above with the disabled violet channel (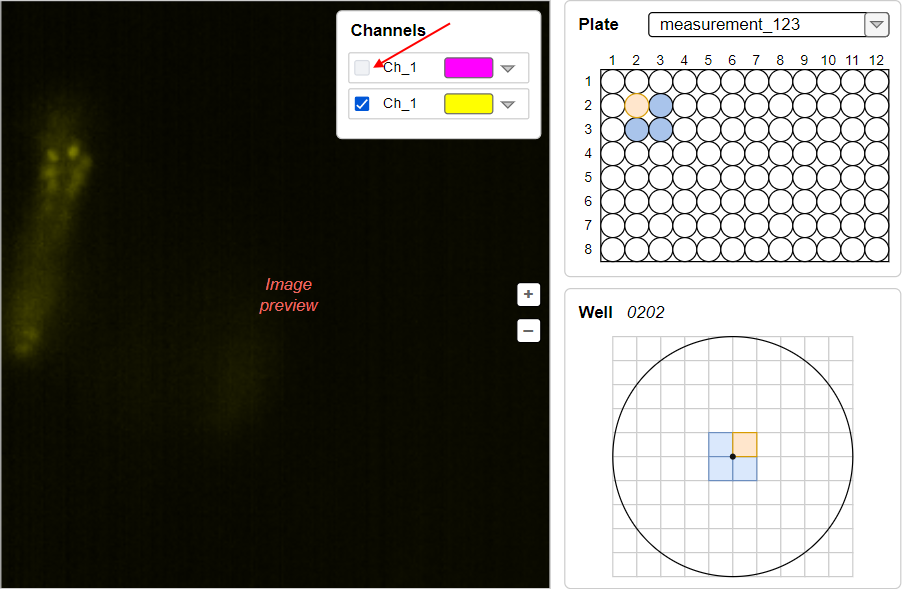
Ch_1):Example of the image above with expanded violet channel settings and regulation of the channel contrast by the slider: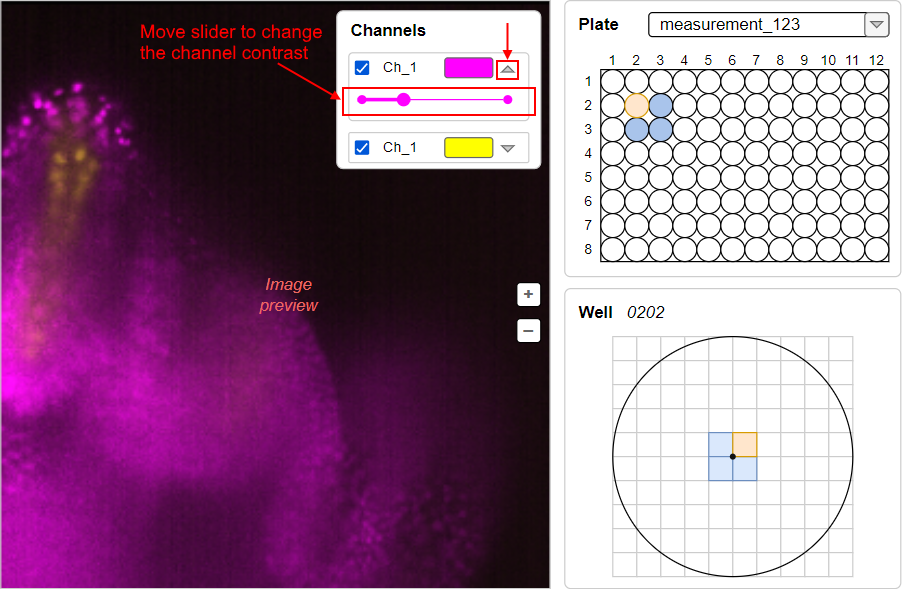
Stack panel
This panel shall allow to change the plane of the displayed well image (i.e. to view images on different depth by z-coordinate). The count of well planes can be defined as max value of the
PlaneIDvalues (<PlaneID>tags inside the<Image>tags). Stack panel should be shown for the plate, only if the count of planes is more than 1.This panel should contain:
<PositionZ>tags inside the<Image>tags) corresponds to that planeExample of the Stack panel for the well with 4 planes: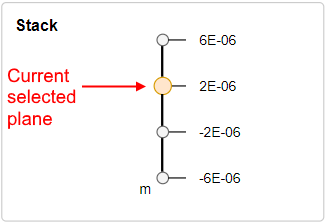
This panel should be located under Well panel (when the count of planes is more than 1). Let's suggest that well image from the main scheme above has 3 planes and we've switched to another one. The view should be like: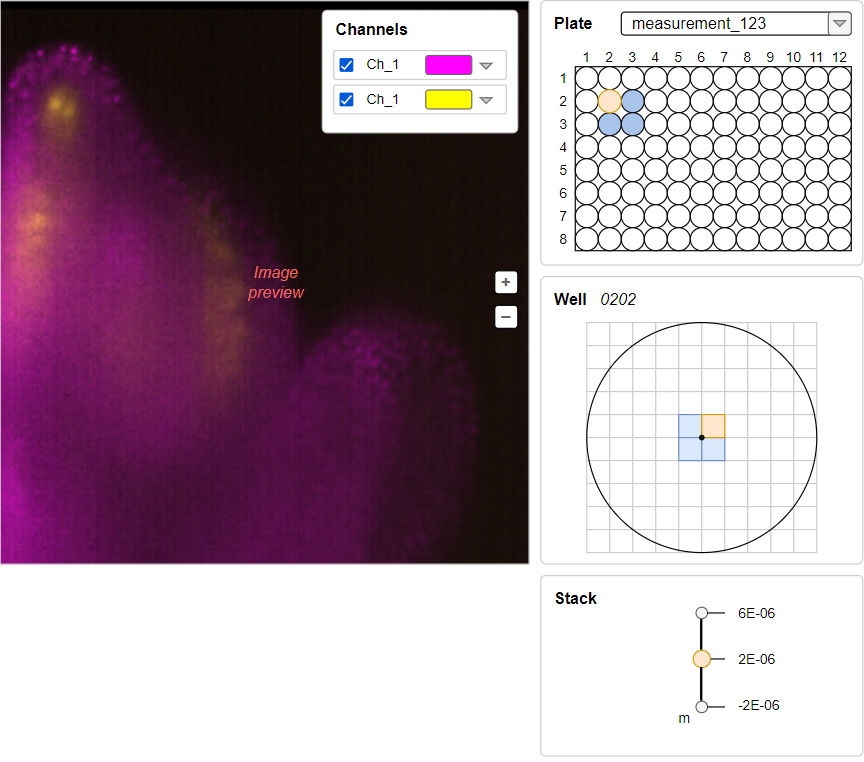
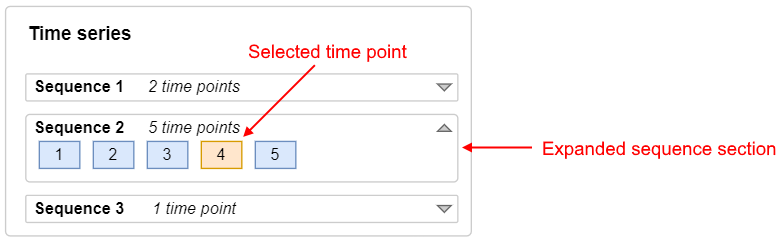
Time series
Well images can be scanned in different time points. The series of the same well images in different time points are united in sequences. Note: often, all images are made in a single time point of a single sequence
If there are several sequences for the plate or in any sequence the count of time points is greater than 1, the Time series panel should appear under the image preview. By this panel, user shall have the ability to select a sequence or/and a time point in a sequence - to receive the well images corresponding this time moment.
The count of sequences can be defined as max value of the
SequenceIDvalues (<SequenceID>tags inside the<Image>tags). The count of time points in a sequences can be defined as max value of theTimepointIDvalues (<TimepointID>tags inside the<Image>tags) for the sameSequenceID.Time series panel should contain:
Example of the Time series panel with 3 sequences: