 epezent
commented
4 years ago
epezent
commented
4 years ago Custom candlestick plots and tool tips:

ImPlot + ImGui Tables API:

Both of these have been added to implot_demo.cpp
Closed epezent closed 3 years ago
epezent
commented
4 years ago Custom candlestick plots and tool tips:
ImPlot + ImGui Tables API:
Both of these have been added to implot_demo.cpp
 PeterJohnson
commented
4 years ago
PeterJohnson
commented
4 years ago Robot simulation GUI for FIRST robotics with multiple plots and drag and drop everything.

epezent
commented
4 years ago @PeterJohnson , I'm curious how you got the linked axes working and if it is bidirectional. This is a feature I've wanted to implement.
 hoffstadt
commented
4 years ago
hoffstadt
commented
4 years ago Some things DearPyGui users have made:


PeterJohnson
commented
4 years ago @epezent It is not bidirectional. I just use SetNextPlotLimitsX() to force the X axis on the second plot to follow the first. Bidirectional is a good idea. I think how I would tackle that is to do the SetNextPlotLimitsX() on the other plots only when one of them is actively being dragged (there would be a 1-frame delay to updating the first plot when you dragged the second plot, but that's hardly noticeable). However, to do this, I would need a method to detect when a plot is being dragged by the user. Is that exposed in implot_internal.h?
 marcizhu
commented
4 years ago
marcizhu
commented
4 years ago Not sure if this one counts, but since I will be using this library to make an application for USB oscilloscopes, I've been doing some experiments where I plotted some (generated) signals into heatmaps in order to visually differentiate the random noise from the real signal. Here's the result:


I want to take this chance to thank @epezent and all the colaborators of this project for this amazing library. Sincerely, thank you all for your amazing work ❤️
 ozlb
commented
4 years ago
ozlb
commented
4 years ago Not sure if this one counts, but since I will be using this library to make an application for USB oscilloscopes, I've been doing some experiments where I plotted some (generated) signals into heatmaps in order to visually differentiate the random noise from the real signal.
@marcizhu Does the sample increase the "weight" and time decrease it? It will be great to have a "light" version in the demo...
marcizhu
commented
4 years ago Indeed, every "hit" of the signal increases the histogram value by 1. I also keep a variable with the maximum value on the histogram at every given moment so that the colors cover the maximum possible range, but using time would also be a solution if you want a "fade out" effect once the signal disappears.
I can post a snippet with the code tomorrow if you guys want :)
epezent
commented
4 years ago @marcizhu, that's cool! What's the performance like? I didn't really optimize heatmaps for high density display, but it'd be an easy fix if it's needed.
epezent
commented
4 years ago Also, @marcizhu, feel free to submit a PR adding a minimal example to the demo :)
ozlb
commented
4 years ago Indeed, every "hit" of the signal increases the histogram value by 1. I also keep a variable with the maximum value on the histogram at every given moment so that the colors cover the maximum possible range, but using time would also be a solution if you want a "fade out" effect once the signal disappears.
I can post a snippet with the code tomorrow if you guys want :)
"Fade out" effect will help you not only when signals disappears but generally when changes it's nature and a plot persistence factor will help you to track signal modulations
marcizhu
commented
4 years ago @marcizhu, that's cool! What's the performance like? I didn't really optimize heatmaps for high density display, but it'd be an easy fix if it's needed.
@epezent The performance is really great: the histogram has a size of 1024x256, and rendering it on a 1280x720 window (the screen is 2560x1600) on a MacBook Pro 2018 (so not the best GPU in the world) I get 60-80 frames consistently. If we take into account the fact that my code is just a quick & dirty demo and it is not optimized at all, I'd say the performance is more than acceptable :)
Also, @marcizhu, feel free to submit a PR adding a minimal example to the demo :)
Great! I will be opening a PR in a few days. Right now I'm a bit busy with university and exams, but once time allows I will definitely open a PR :+1:
"Fade out" effect will help you not only when signals disappears but generally when changes it's nature and a plot persistence factor will help you to track signal modulations
@ozlb That's totally true. I will try using time instead of just tracking the maximum value of the histogram and if the end result looks nice, I will add that to the demo instead :D
 ejyanezp
commented
4 years ago
ejyanezp
commented
4 years ago Here is an application to display seismic data, thanks to the implot project.

 ddovod
commented
4 years ago
ddovod
commented
4 years ago My deep reinforcement learning playground, heavily using different kinds of plots. Big thanks to implot!

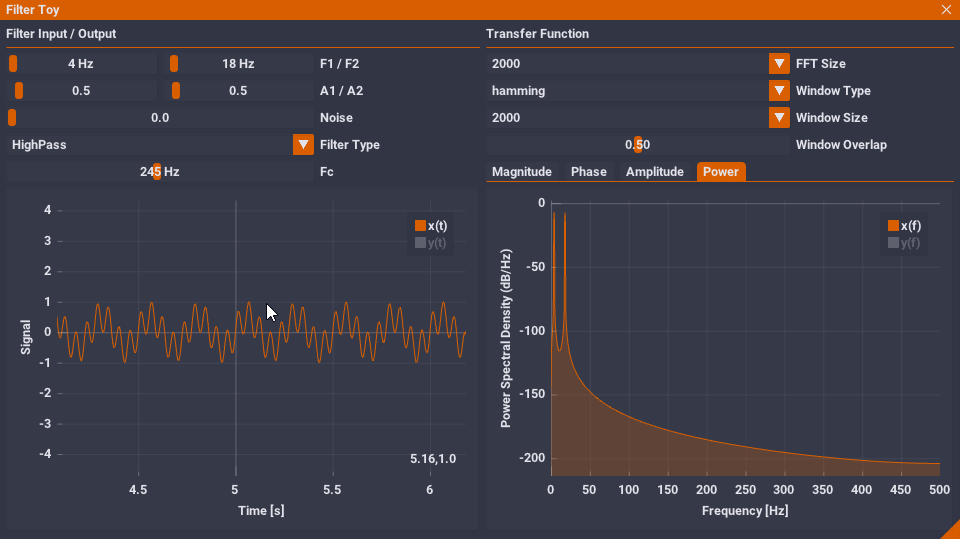
epezent
commented
3 years ago A quick little toy I put together while working on some DSP algorithms.
 elvissteinjr
commented
3 years ago
elvissteinjr
commented
3 years ago Desktop+ is a tool to bring your desktop and more into SteamVR. A recent addition is the Performance Monitor.
ImPlot is used here to render the frame time graphs.
 This is pretty basic as far as plotting goes, but I just wanted something to render neat looking graphs in Dear ImGui and ImPlot fit the bill nicely. Thanks for that.
Post your screenshots or custom code here and tell us about your project!