 dniku
commented
8 years ago
dniku
commented
8 years ago Closed epogrebnyak closed 8 years ago
dniku
commented
8 years ago  epogrebnyak
commented
8 years ago
epogrebnyak
commented
8 years ago Which of the edits in 603f140b2956822ae1050b58fcd8044a93cc4f8d is responsible for solving the issue? There are many style edits in the commit.
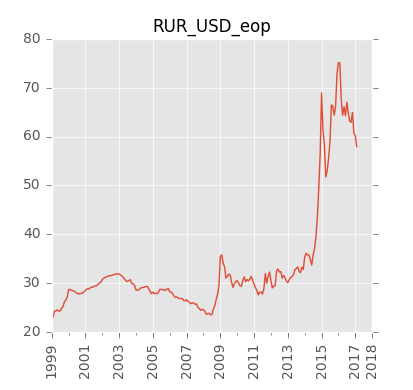
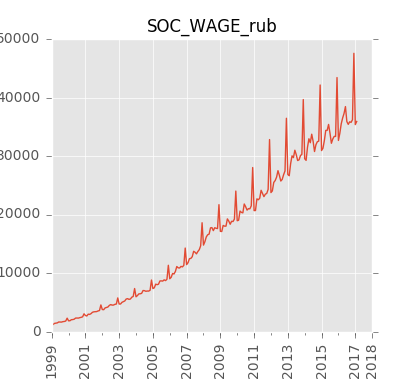
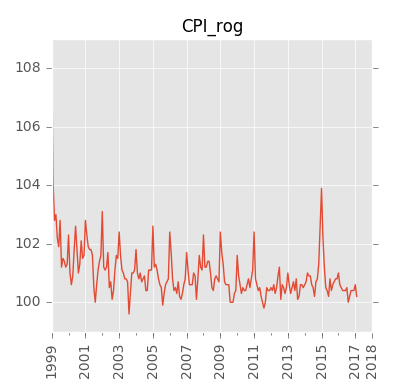
One thing to look for is 2016 printed as last lable (now it isn't), need to see code responsible for the issue to decide hoe solution works.
As a rule - who open an issue - closes it. This way it one can ensure if the specification was met.
epogrebnyak
commented
8 years ago Actually - need 2016 as last label on X axis.
dniku
commented
8 years ago The relevant code I pushed is at https://github.com/epogrebnyak/rosstat-kep-data/blob/master/kep/query/plots.py#L112-L124. I'll look into adding an extra label.
dniku
commented
8 years ago This turned out to be surprisingly difficult to fix.
In matplotlib, tick locations and labels are controlled by subclasses of Locator and Formatter, respectively. In addition to using its own convention for representing dates, pandas uses its own custom subclasses of Formatter to implement labels. For our particular case, it uses TimeSeries_DateFormatter.
The problem with this class is that it completely ignores modifications to tick types and locations, and instead internally recalculates everything by itself. For that, it stores some extra data in Axes, specifically, in a field called date_axis_info. I have tried to manipulate it, but for some reason it was None while plotting in PDFs.
Since dates are represented differently in pandas, matplotlib's standard DateFormatter doesn't work either. Instead, I have subclassed TimeSeries_DateFormatter and added a small patch that takes into account custom tick locations. While this is still dependent on pandas internals, this is much less error-prone.
epogrebnyak
commented
8 years ago Any idea why these are still without end label 2017:
dniku
commented
8 years ago The images you've referenced look okay to me:
epogrebnyak
commented
8 years ago Maybe just a browser cache... please ignore.
epogrebnyak
commented
8 years ago NOTE (EP): may aslo need to test #NA row ending.
Extend X axis in pdf and png graphs so that it has full current year (now to end of 2015, in 2016 to end of 2016). This way the line with data will end not on right edge of a graph but somewhere before that.
This may be an equivalent of adding #na to the end of year in monthly data series.