 sbrk-r
commented
3 weeks ago
sbrk-r
commented
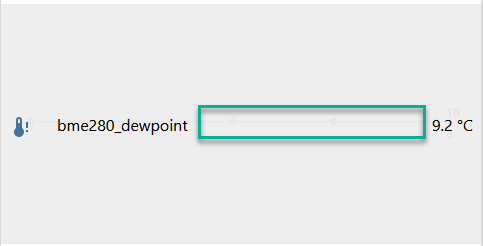
3 weeks ago It looks like it is supposed to be faint until the cell of the chart is selected, then it should expand and become less faint. src
It doesn't happen for me on firefox 115.9.1esr, the cell expands but the graph does not, and opacity does not change either.
firefox:
konqueror:
I think probably it wouldn't hurt to dial up both opacity a little bit... I didn't even notice there was a graph before I read this.
I think for custom settings you will have to clone https://github.com/esphome/esphome-webserver, edit css, build, and deploy the resultant .js file onto a server you control for the nodes to fetch it from. - I'm not familiar with the process so that might be wrong.
It is also possible to host it on the node itself, if you have room web server component
 geotibi
The problem
In the last webUI interface I can see some "data" that is not very visible. 1st I was thinking that is because of my old monitor but than I was observing the same on the laptop. Where I have the sensor value on the up and down side of the current value I can see numbers which I guess is referring to max and min value, numbers which are not very visible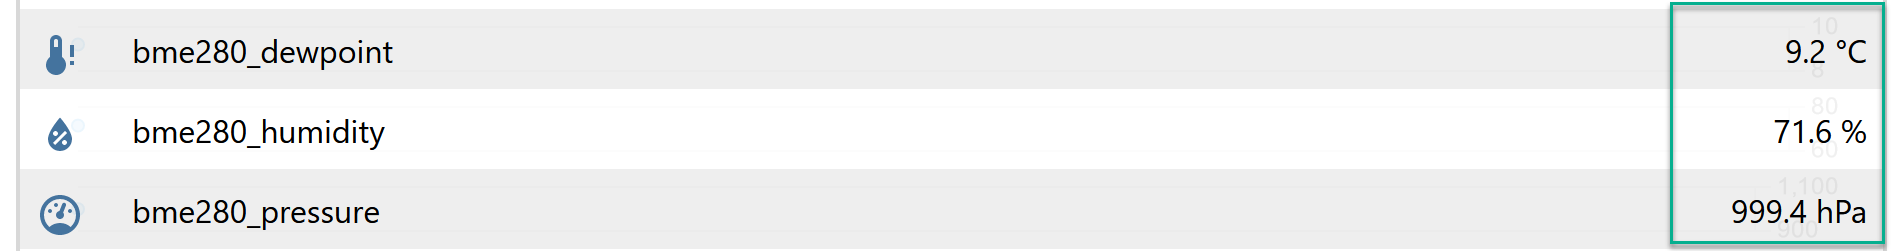 Also between the sensor name and the value I can see somthing like a graph, also not very visible like in the picture
My question is: can I do something to change the style of these numbers and the graph to be more visible?
Which version of ESPHome has the issue?
2024.4.1
What type of installation are you using?
Home Assistant Add-on
Which version of Home Assistant has the issue?
2024.4.3
What platform are you using?
ESP8266
Board
No response
Component causing the issue
No response
Example YAML snippet
No response
Anything in the logs that might be useful for us?
No response
Additional information
No response