jngrad
commented
4 years ago
jngrad
commented
4 years ago The behavior persists when using visualizer.run(0), so the bug must be contained in the cython file visualization_opengl.pyx. The memory leak rate of a polymer simulation when bonds are not drawn with open draw_bonds=False is identical to that of a LJ liquid: 0.3 MiB/min leak rate and same memory usage curve.
There seems to be a missing memory deallocation in function draw_cylinder(). Adding OpenGL.GLU.gluDeleteQuadric(quadric) doesn't change the graphical output but reduces the memory leak rate down to 0.3 MiB/min. The memory deallocation is also missing in a few shapes (SpheroCylinder, SimplePore, SlitPore), causing a 3 MiB/min leak for an array of 100 spherocylinders. This was easy to fix. After that, the spherocyliner array memory usage grows by 1.5 MiB/min for the first 4 minutes, then becomes constant for 10 min, decreases by half rapidly, and remains constant. This doesn't look like a memory leak anymore.
I couldn't find any other GLU memory allocation with new allocation, and all memory allocations of a matrix on the OpenGL transformation matrix stack are followed by a memory deallocation. I don't know what causes the 0.3 MiB/min leak rate for spheres, but it's somewhat reasonable, e.g. it leaks 100 MiB every 6 hours of visualization. There is no memory leak when the system is empty.
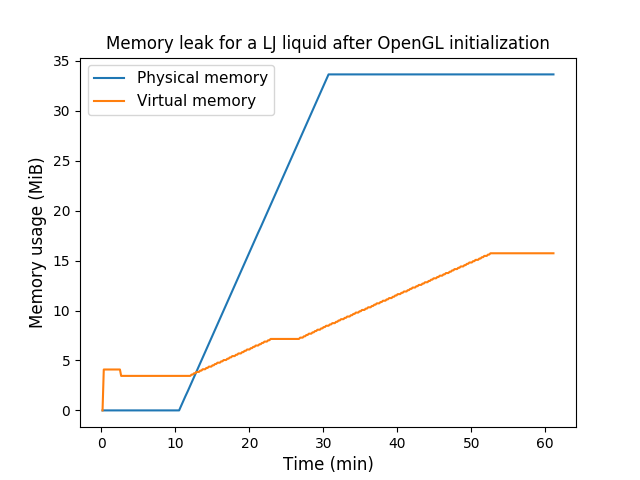
There is a memory leak when running a simulation with the OpenGL visualizer. The leak rate is around 12 MiB/min for a polymer (
visualization_bonded.py) and 0.3 MiB/min for a Lennard-Jones liquid (visualization_ljliquid.py). It does not change when doubling or halving the number of particles in the system. The leak persists even if the simulation freezes, e.g. when the for loop in the integration thread stops. Not sure if the bug comes from the espresso code or from the OpenGL driver. Issue reported by the mailing list. Confirmed on the current python branch (cd66da057d) and 4.1.2 release.Here is a shell script to measure memory usage of a simulation as a function of time. The monitoring loop stops when the visualizer window is closed by the user.
Data processing with matplotlib:
The polymer has a linear trend, the LJ liquid has steps: