facebook / memlab

A framework for finding JavaScript memory leaks and analyzing heap snapshots
https://facebook.github.io/memlab/
MIT License
4.35k stars 118 forks source link

Possibility to analyze memory leaks/usage in Electron desktop apps #51

Closed fish-never closed 1 year ago

fish-never commented 1 year ago

Hi Team,

First, Thank you very much for making this project open source.I have actually experienced its charm in web projects。

But my question is, Is it possible to analyze the memory usage or leaks in Electron desktop apps?

JacksonGL commented 1 year ago

Yes. You can open the DevTools in Electron apps and take heap snapshots manually. Use the following commands to diff the heap snapshots and find leaks:

memlab find-leaks --baseline <PATH-1> --target <PATH-2> --final <PATH-3>

baseline, target, and final corresponds to snapshot of A, B, and A' in the following animation:
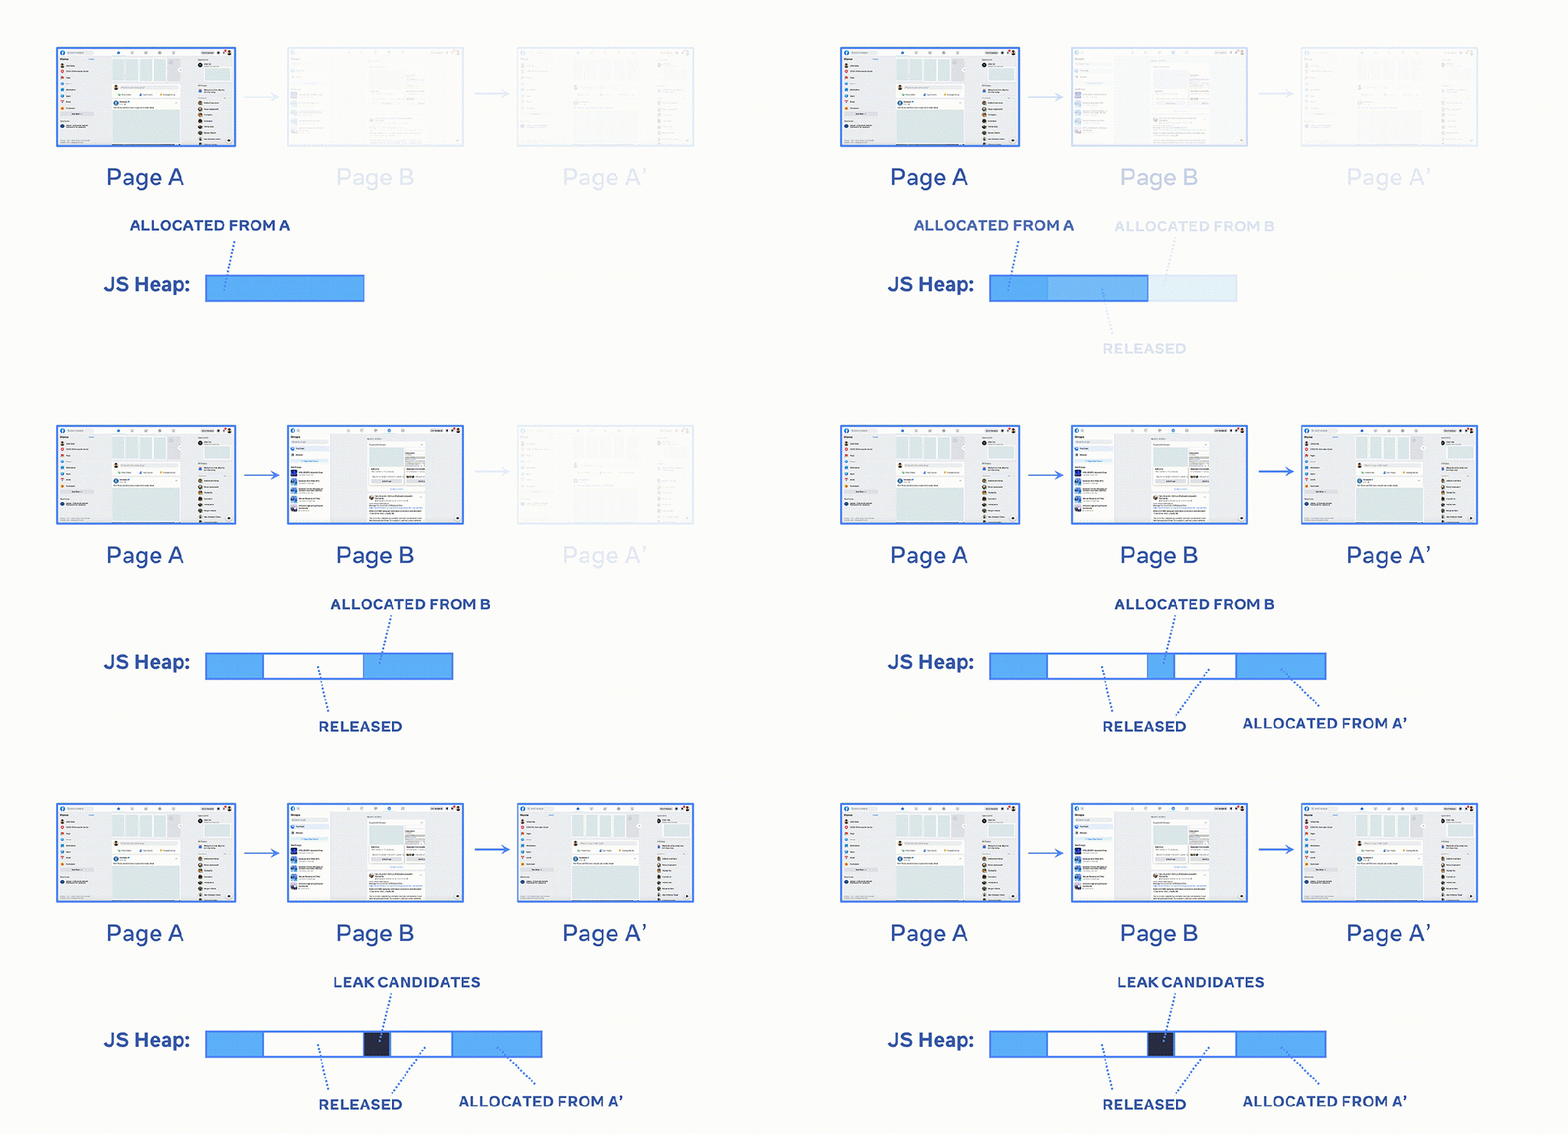
To analyze a single heap snapshot, please take a look at the helper text from the following command:

memlab analyze -h
fish-never commented 1 year ago

thank you very much! I tried to use memlab to automatically take a snapshot in the electron application yesterday, but it was blank. And I should take a snapshot manually and then analyze it with memlab, right?

JacksonGL commented 1 year ago

@fish-never Yeah, taking snapshots manually and analyzing with memlab should work.

MemLab's CLI only supports E2E automation for web pages, I'm curious how you used memlab to automatically take a snapshot in the electron application?

fish-never commented 1 year ago

I'm sorry and I just force it unreasonably. By the way, I tried to take a snapshot manually several times, but the results of the same process are different. Is the analysis result still valid in this case?

JacksonGL commented 1 year ago

By the way, I tried to take a snapshot manually several times, but the results of the same process are different.

If you take multiple heap snapshots without interacting with the UI, it makes sense to have slightly different heap snapshots since JS code may have pending timer activities that triggers some changes in the JS heap. The analysis result is still valid (some memory leaks triggered by those pending activities may or may not be captured pending on which heap snapshot you use).