 bletham
commented
6 years ago
bletham
commented
6 years ago The predictive uncertainty interval will be a combination of two things: fitted observation noise, and future trend uncertainty.
Increasing the changepoint prior scale will make for a more flexible trend, which will generally increase future trend uncertainty.
However, a more flexible trend could also allow the model to fit the data better, and thus lower the fitted observation noise. When the changepoint prior scale is too tight, the model might be missing changepoints and instead fitting them as being observation noise. I would expect this is probably what is happening here.
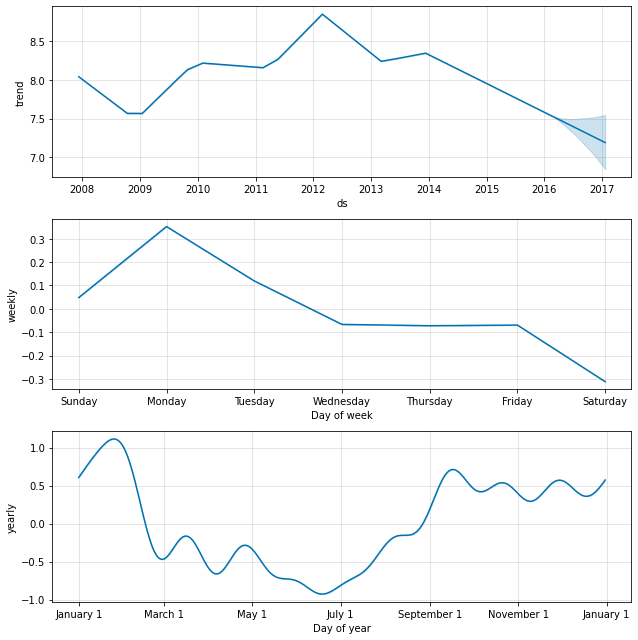
The clearest way to know what is happening would be to just look at the trend in the components plot, which will show the past trend changes and the uncertainty (i.e., top row here https://facebook.github.io/prophet/static/quick_start_files/quick_start_14_0.png). If the uncertainty is not growing as you get further from the final date in the time series, then you should see in that plot that there is no uncertainty in the trend. My guess in this case would be that there are few/no historical changes in the trend. Future trend uncertainty is estimated by projecting forward the rate of trend changes in the history, so if in the history the trend was constant, the future will have little uncertainty in the trend being constant. If that isn't clear, if you post the components plot that could be helpful to discuss further.
From what I read, increasing changepoint prior scale should increase the uncertainty intervals, which makes sense. However, curiously, when I apply this to my model, it seems to DECREASE the uncertainty. That is, it decreases the mean gap between yhat_lower and yhat_upper. Furthermore, I found that the uncertainty intervals are constant - range between them is always more or less the same number, regardless of how early or how far into the future I'm trying to predict. In reality, I would expect that more distant predictions would have a higher uncertainty interval, no?
This seems really strange and rather counterintuitive. Any idea what could cause this, or what this could be an indication of?