 mikeconley
commented
7 years ago
mikeconley
commented
7 years ago FWIW, Jan de Mooij built an external tool to help find the top functions:
https://jandem.github.io/profileviewer/
Would it be possible to use that as a starting point to get something like this added to perf.html?
 julienw
 digitarald

 mstange
 smaug----
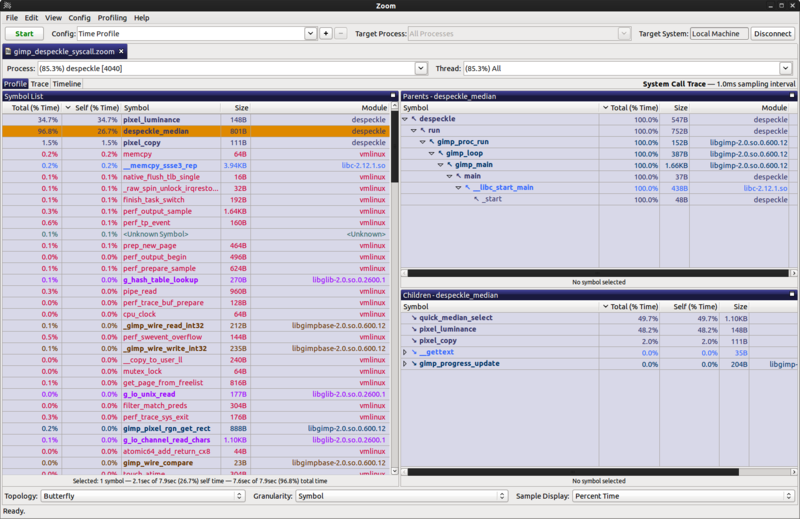
 jandem
 gregtatum
 parttimenerd
In a "top functions" view, all functions are displayed in a flat list (no tree structure), sorted by "inclusive time", i.e. sorted by the number of samples where this function is present anywhere on the stack.
Example:
In this example,
ProcessElementis near the top of the list, and easy to find. In the current call tree you have to look for it under two different stacks.I think we should have such a mode. We could make it a different mode inside the existing Call Tree tab, or we could have a new tab for it.
In addition, from each function, it should be possible to:
For example, we could split the tab three ways: the list on the left, and two tree views on the right, above each other, with the upper one showing 3 and the lower one showing 4.
┆Issue is synchronized with this Jira Task