fivethirtyeight / data

Data and code behind the articles and graphics at FiveThirtyEight
https://data.fivethirtyeight.com/
Creative Commons Attribution 4.0 International
16.7k stars 10.96k forks source link

538 approval rating transparency #289

Closed blazespinnaker closed 1 year ago

blazespinnaker commented 2 years ago

Can you publish the code you're using to calculate the 538 approval rating here - https://projects.fivethirtyeight.com/biden-approval-rating/

Given the national consequence of such a rating and the fact that its being traded on weekly with million dollar volume, I think it'd be ideal if 538 was transparent about how they're calculating these values.

Right now, for example, because the results of a poll could move it when a model is recalculated - only insiders know the latest values until its updated on the website.

Code will allow anyone with access to polls the ability to precisely predict what the value will be before 538 has a chance to update it . This will increase its nationwide credibility and ensure that nothing untoward is occurring.

cheers

blazespinnaker commented 2 years ago

Futhermore, I noticed that a poll was removed. 139395

eg:

https://web.archive.org/web/20210823082432/https://projects.fivethirtyeight.com/biden-approval-rating/polls.json

It's not in the latest polls.json here - https://projects.fivethirtyeight.com/biden-approval-rating/polls.json

Why was it removed? Did removing this poll have any impact on model recalculation? I haven't done a full analysis via wayback on whether any other polls have been removed. Can you explain the significance of this?
blazespinnaker commented 2 years ago

One more question - have you changed the model code or any of the parameters since the beginning of Biden's presidency?

abitrolly commented 2 years ago

The website looks like every president is cut down on after 200 days. Would be interesting to see real graph - how many days those guys are able to sustain before failing below 50%. Then linking that to how it connected to media coverage would be interesting as well.

blazespinnaker commented 2 years ago

Another detail which seems odd is that the weight / influence at the bottom of the page in the csv isn't the same as the weight published on the website. When taking influence into account, they are actually not the same at all.

blazespinnaker commented 2 years ago

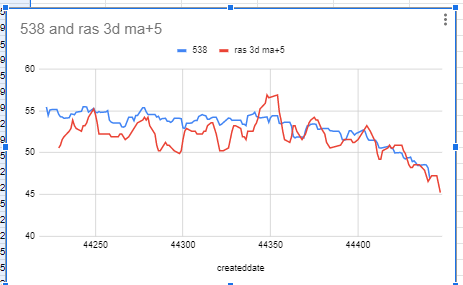
Another strange detail is that the correlation with Ras has increased significantly lately. Was this due to a change in methdology?

It's fairly obvious someone obviously changed something. The Pearsons correlation went from 0.08912093937 (first 100 points) to 0.9088227065 (last 20 points), between straight rasmussen (not using moving average) and 538

Using 3point moving average (unshifted) Rasmussen versus 538 it goes from 0.1146254118 to 0.9710678679.

The problem is, we don't really know if it's ras changing things or if 538 is changing their methodology because 538 doesn't publish their code. We can only suspect.

Ras/538

jayb commented 1 year ago

We don't publish the code behind our approval ratings, though perhaps one day we will.