flet-dev / flet

Flet enables developers to easily build realtime web, mobile and desktop apps in Python. No frontend experience required.
https://flet.dev
Apache License 2.0
9.59k stars 372 forks source link

Charts #68

Closed FeodorFitsner closed 1 year ago

FeodorFitsner commented 1 year ago

https://github.com/google/charts

PierreFaraut commented 1 year ago

Hi! Have you considered also echarts library? It provides a large number of possibilities regarding charts. A simple json with the options has to be provided and the library does the rest. Here is the implementation in flutter: https://pub.dev/packages/flutter_echarts

FeodorFitsner commented 1 year ago

I see that comment Since it is based on webview, this library has some inextricable instability and performance issues. We recommend the Flutter charting library Graphic as an alternative. and then looking at Graphic library I must say it looks impressive, especially nice Rows use it.

PierreFaraut commented 1 year ago

Well, I was thinking of this kind of answer 👍 Look forward to use try charts in Flet! Hope we will have it soon :) Do you have any idea when we will be able to try? Thanks a lot!

FeodorFitsner commented 1 year ago

Sure, still have to decide on the supported library :)

pbk0 commented 1 year ago

@FeodorFitsner .... Is this on roadmap ?? i.e. the Graphics library I assume

FeodorFitsner commented 1 year ago

Google charts have been discontinued, yes. I'm also considering https://pub.dev/packages/fl_chart

scipio-nl commented 1 year ago

Flutter Candlesticks packages, consider: (1) https://pub.dev/packages/interactive_chart or (2) https://pub.dev/packages/candlesticks

Nota bene: it would be a lot better if drawing objects can be user-drawn on top of the candlestick chart for so-called "technical analysis":

BezBartek commented 1 year ago

@FeodorFitsner Is it planned to add it in the near future? thank you!

FeodorFitsner commented 1 year ago

Sure, fl_chart is in our TODO.

ndonkoHenri commented 1 year ago

fl_chart is good, but syncfusion_flutter_charts looks way more better. Have a look at this website they made to showcase the power of their package. Hover to see the magic. It's just amazing!

ndonkoHenri commented 1 year ago

Oh. Seems like I spoke a little tooo fast. I am just from seeing this disclaimer:

Disclaimer: This is a commercial package. To use this package, you need to have either Syncfusion Commercial License or Free Syncfusion Community license. For more details, please check the LICENSE file.

Let me know what you guys think of all this.

FeodorFitsner commented 1 year ago

Syncfusion looks very tempting, but, unfortunately, we can't use it in Flet because of licensing.

clstaudt commented 1 year ago

Advocating for making pythonic chart libraries (matplotlib, seaborn, plotly, altair) first class citizens in flet.

pbk0 commented 1 year ago

@FeodorFitsner we are waiting for some interactions. BTW, this is different question, please redirect me to other thread if needed. How can we extend your work and add support for more UI elements ... Like for example, if someone wants to add fl_chart how can he approach doing that? It would be nice to have a guide where we can get some simple flutter library and add it under flet.

FeodorFitsner commented 1 year ago

I'm looking into making custom backend for Matplotlib to allow interactions.

BezBartek commented 1 year ago

@FeodorFitsner If I can, I would like to point that currently there is no way to create nice, customizable dashboard using flet. matplot lib or plothy are great, but not for nice commercial business apps with specific UI requirements. I think that flet have huge potential, in field that is not so often discussed here, as business manager app, In case like that there are only few users (so server side event handling is not a problem) so there are multiple benefits that flet offers almost without cons. In my company, we tested the flet framework as replacement of angular for that purpose for one of ours clients, and it fit great, client was astonished of level of interactivity. But current lack of interactive plots blocking us from using it in other projects, where it might fit great, and push us into JS ;/. I know that there are multiple requests of hundreds of feature and charts are already on to-do list, but still, I think that nice interactive charts library (like fl_chart, or any other) is something, that deserves for high priority Thank you for great library, and I hope some charts support coming really soon :)

FeodorFitsner commented 1 year ago

Thank you for your thoughts!

So, fl_chart would make you happy? :) I have started implementing it a while ago but then postponed. Looks like the right time to get back to it!

BezBartek commented 1 year ago

@FeodorFitsner Ye, it would be great, Thank you! :)

clstaudt commented 1 year ago

@BezBartek Why is plotly not suitable for an interactive dashboard?

BezBartek commented 1 year ago

@clstaudt I said "not for nice commercial business apps with specific UI requirements". I didn't say "not for an interactive dashboard". In general (out of flet context) Plotly is interactive and is amazing, and there are multiple dashboards build with it, but it is designed as data analyst tool in mind. To load huge amount of data, and give an ability to deeply analyze that huge data set in interactive way. Dashboards generated by libraries like fl_charts, or a lot of other plot libraries for web developers, mostly in JS, are focused more on look and fast loading of smaller amount of data, that can be easily updated, and do some fancy animations on loading/updating. You can see it simply by investigating how example plotly charts look like, and how others (fl_charts) or most JS libs charts look like. Plotly is not what you are looking for if you have to create dashboard according to mockups, that will fit the rest of UI. There are huge demand of apps with charts that just look smooth, on mobile, web, and so on

mpikmwm commented 1 year ago

I'm looking into making custom backend for Matplotlib to allow interactions.

So the the toolbar gets usable, etc. ? Right now only images are supported, correct? grafik

ndonkoHenri commented 1 year ago

@mpikmwm A New version has lately been released with more interactive charts. Install the latest flet version, and check the docs: https://flet.dev/docs/controls/charts

FeodorFitsner commented 1 year ago

https://flet.dev/blog/flet-charts

mpikmwm commented 1 year ago

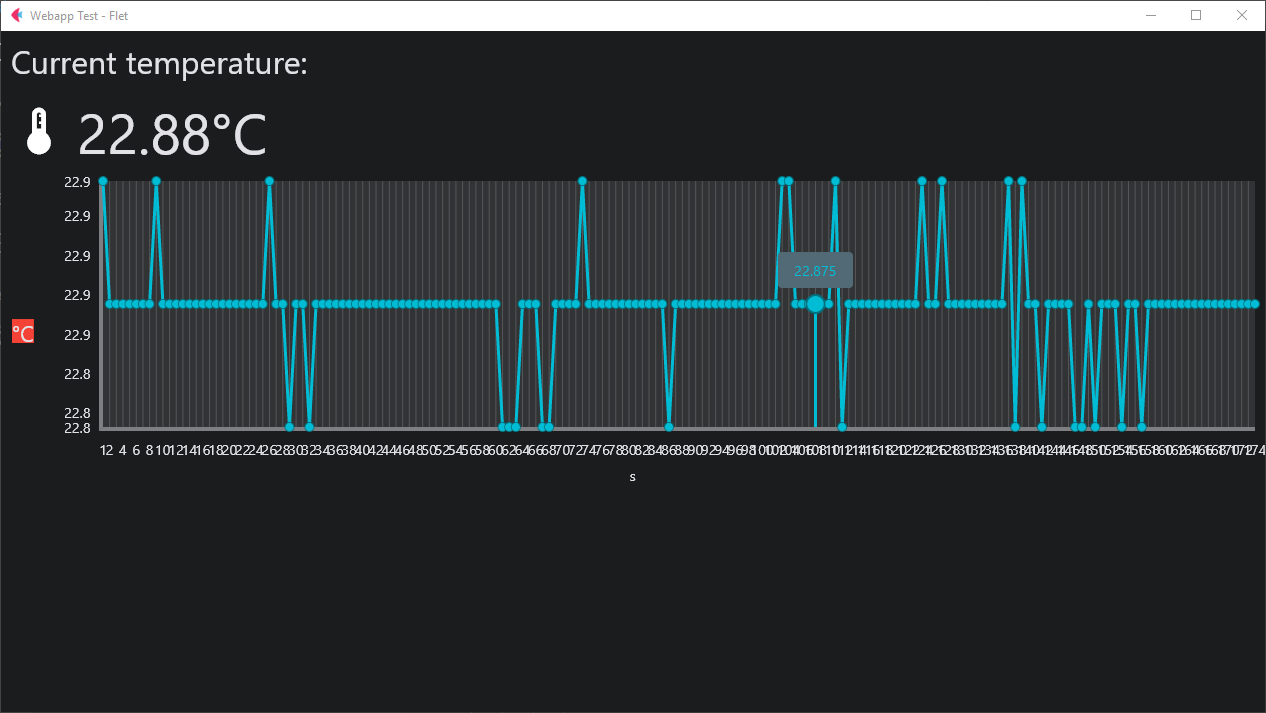
Not sure if this still is the corret place, please correct me if I'm wrong. I've played around with the new charts and they are very cool, thank you for that. Still I have some questions. Is there a way to more the title on the left axis to the top? And The autolabes that are created have problmes if the values are very close. grafik

mpikmwm commented 1 year ago

Additionally, can the autolabe be set to display the x-axis value?

FeodorFitsner commented 1 year ago

Sure, first, you can change ChartAxis.labels_interval and, second, put custom labels to override default ones: https://github.com/flet-dev/examples/blob/main/python/controls/charts/linechart-sample-1.py#L137-L175

Third, Canvas control is coming this week, so you would be able to draw your own chart :)

mpikmwm commented 1 year ago

Now that canvas is out there, can the matplotlib backend be used with it, for interactive matplotlib graphs inside flet?

FeodorFitsner commented 1 year ago

@mpikmwm I guess so, as Canvas provides all necessary primitives.