fr-ser / grafana-sqlite-datasource

Grafana Plugin to enable SQLite as a Datasource
Apache License 2.0
124 stars 17 forks source link

RFC: Allow a query to pull multiple time series #88

Closed corto25 closed 2 years ago

corto25 commented 2 years ago

For a hypothetical query like this one:

SELECT
  'Experiment: ' + experiment_type as label,
  sample_unix_timestamp as timestamp,
  sample_value as value
FROM
  myExperimentsTable
WHERE
  sample_unix_timestamp BETWEEN $__from/1000 AND $__to/1000
  AND experiment_type in ('foo', 'bar', 'baz')

The query itself selects which timeseries are to appear, it prepares the data into 3 columns with predefined names.

Expectation: The grafana-sqlite-datasource plugin should produce a graph that shows all 3 timeseries (my experiment_type) and the label for these timeseries should be the value I specify as the label column, they are time-indexed by the timestamp column and valued by the value column.

Exact column naming is up to the maintainers but ability to select multiple timeseries in one query is the essence of this RFC.

fr-ser commented 2 years ago

Sounds interesting and I'll take a look either way. What would really help me out though, would be an example query (preferably with a CTE as data source) that I could pop in to Postgres to see how they handle it.

I assume the Postgres data source (as an example of a native SQL data source) already implements the desired behavior?

corto25 commented 2 years ago

I have an sqlite db file that contains my computer's loadavg 1, 5, 15 every 1 minute for several months. It contains a lot more, so I'll look into extracting just those and simplifying the schema to the bare minimum.

As for PostgreSQL, I have no idea and I'm not interested. I'm comparing your plugin to the Prometheus data source.

On Wed, Jun 22, 2022, 08:13 Sergej Herbert @.***> wrote:

Sounds interesting and I'll take a look either way. What would really help me out though, would be an example query (preferably with a CTE as data source) that I could pop in to Postgres to see how they handle it.

I assume the Postgres data source (as an example of a native SQL data source) already implements the desired behavior?

— Reply to this email directly, view it on GitHub https://github.com/fr-ser/grafana-sqlite-datasource/issues/88#issuecomment-1163238913, or unsubscribe https://github.com/notifications/unsubscribe-auth/ALIKO6EAWIUUDMGROEVHYR3VQMUQLANCNFSM5ZQR4WFA . You are receiving this because you authored the thread.Message ID: @.***>

corto25 commented 2 years ago

This file is the Sqlite3 DB that contains one table with 3 datasets: loadavgs.zip

This file is an example Grafana dashboard that queries and displays the data in the loadavgs.zip file: Sqlite Load Averages-1656180006210.zip

Image 1: image 
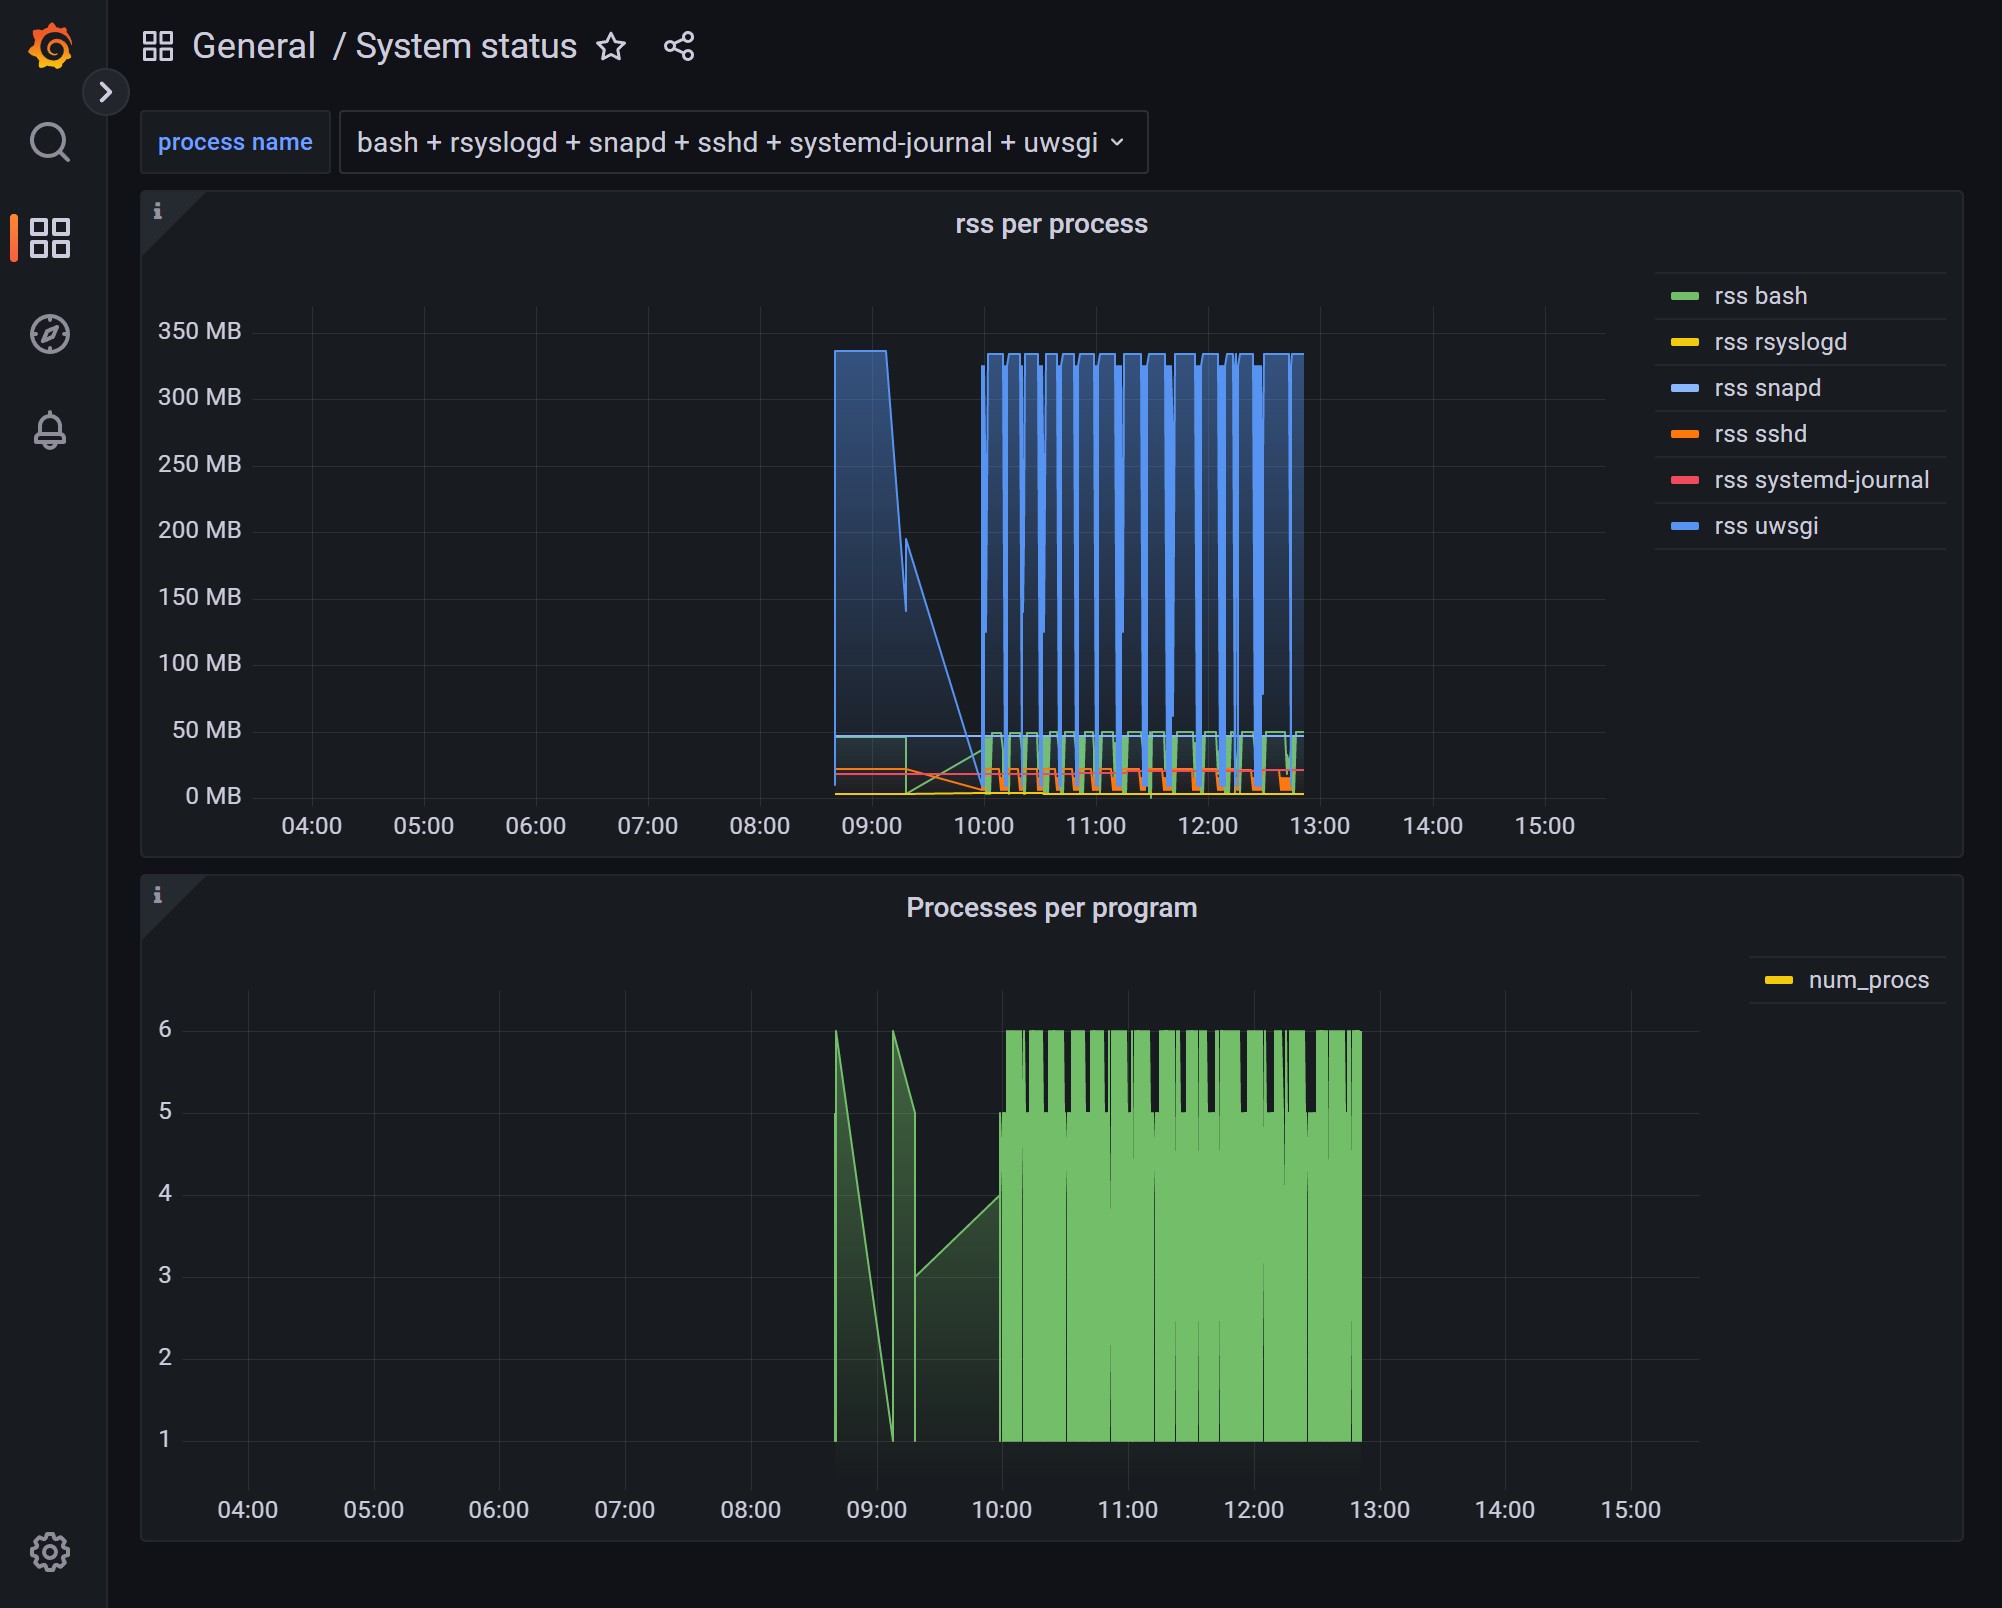
In the image above, the 3 time-series are added as individual Grafana query. It requires exact knowledge of how to query each individual time-series. This is the least ideal solution, but it is supported this way today. Note, that I'm not sure how to control the label showing loadavg1 loadavg1 instead of just loadavg1.

Image 2: image In the image above, the 3 time-series are added via a single SQL query in a single Grafana query. To achieve the 3 time-series in one, it is required by this plugin to have the 3 time-series as separate columns. This means a dataset that has all in one table needs to be transposed from an inner query, or other ways would require two joins. This also requires exact knowledge of the dataset contents and is tedious to use if we have something like 100 time-series.

The ideal should look and feel like Image 2, but the query should ideally look like this:

SELECT
  unix_timestamp,
  format("loadavg %d", avg_span_minutes) as label,
  value
from load_averages_t
where unix_timestamp between $__from/1000 and $__to/1000

This allows users to specify labels precisely using SQLite.

Or imagine a query such as this one:

SELECT
  sale_timestamp,
  region as label,
  sum(sale_amount) as value
from sales_t
where unix_timestamp between $__from/1000 and $__to/1000
group by sale_timestamp, region
teodesian commented 2 years ago

This could be supported with variable expansions. E.G.

SELECT
name as label,
time,
value
FROM some_table
WHERE
time between $__from/1000 and $__to/1000
AND
name IN $names

where you would have the dashboard var $names populated by:

SELECT distinct(name) FROM some_table;

Variable expansions can be single values, multivariate or "all", which will require different interpolations. currently the plugin interploates single as the bare value, and multi/all as the values in braces {} separated by commas. as such, this is currently broken for multi/all variable selection.

Not sure what has to be changed to fix the interpolation here, assuming this is just default behavior for plugins.

teodesian commented 2 years ago

looks like it would involve modifying pkg/plugin/variables.go to handle the case of all other variables in the query and replace them with the appropriately interpolated values (likely using reflect to discriminate between array/string values). It may be that you can link against the sqlite go bindings and use their escaper directly.

teodesian commented 2 years ago
replace(replace(replace('$var','{','("'),'}','")'),',','","')

Using that in a recursive CTE to split the values looks to work for the multivariate case. Not pretty, but may be the answer

teodesian commented 2 years ago

Example of CTE that works with vars to have multi-series charts:

WITH RECURSIVE cte(org, part, rest, pos) AS (
  VALUES(replace(replace('$process','}',''),'{',''), '',replace(replace('$process','}',''),'{','')|| ',', 0)
  UNION ALL
  SELECT org,
         replace(SUBSTR(org, pos+1, INSTR(rest, ',') ),',',''),
         SUBSTR(rest, INSTR(rest, ',')+1),
         pos + INSTR(rest, ',')
  FROM cte
  WHERE INSTR(rest, ',') > 0
) SELECT
time,
name as displayName,
(rss / 1024) as rss
FROM procsummary
WHERE
name IN (select part from cte)
AND
time >= $__from / 1000 and time < $__to / 1000

Queries a table of processes by name with their rss in kbytes (reduced to mb), with the $process var being the distinct process names seen in the table.

Good enough for my purposes, but an IN style interpolation would certainly save a lot of effort.

fr-ser commented 2 years ago

This could be supported with variable expansions. E.G.

SELECT
name as label,
time,
value
FROM some_table
WHERE
time between $__from/1000 and $__to/1000
AND
name IN $names

where you would have the dashboard var $names populated by:

SELECT distinct(name) FROM some_table;

I am not sure how this addresses the initial use case of this issue. How is this related to showing the results as multiple labelled time series?

fr-ser commented 2 years ago

@corto25, after playing around a bit with your requirements it seems to me that they are already working (with the time series option instead of a table option in case you haven't tried that yet). The query below generates a result for me that splits the result into multiple series with one query

with data(time, temperature, city) AS (VALUES
(724125600, 10, 'London'), (724161600, 11, 'London'),
(724161600, 20, 'New York'), (724197600, 21, 'New York'),
(724125600, 25, 'Washington'), (724197600, 26, 'Washington')
) SELECT * from data
order by time
image

I could also use your sample data to generate such a view

SELECT
  unix_timestamp,
  format("loadavg %d", avg_span_minutes) as label,
  value
from load_averages_t
where unix_timestamp between 1614560400 and 1617066000
order by unix_timestamp asc

Could you clarify for me if this solves your use case already or am I missing something?

teodesian commented 2 years ago

I think I am being fooled by an odd behavior which is very likely related to this issue. I am observing that two panels with near identical queries along the lines described above which have different output. The first one in fact shows multiple series filterable by var, the second does not.

First chart is sum of RSS across various processes with the same name. Second is just count of processes with that name, filtered by variable.

The second one steadfastly refuses to have multiple series. I'm not sure why only the first chart works; ideally the second chart would work like the first one. bug

I can provide the dashboard json and the source data if needed.

teodesian commented 2 years ago

Anyhow, having to write a recursive CTE in a WITH clause in order to filter by var easily is less than ideal. I'll file a separate issue on that.

corto25 commented 2 years ago

The main goal is to avoid having to specify which time series to include. So as new data comes through, new time series will appear automatically.

RFC is to add support for the select timestamp, label, value ... query style and produce individual lines for each distinct labels.

On Mon, Jun 27, 2022, 09:58 George S. Baugh @.***> wrote:

This could be supported with variable expansions. E.G.

SELECT name as label, time, value FROM some_table WHERE time between $from/1000 and $to/1000 AND name IN $names

where you would have the dashboard var $names populated by:

SELECT distinct(name) FROM some_table;

Variable expansions can be single values, multivariate or "all", which will require different interpolations. currently the plugin interploates single as the bare value, and multi/all as the values in braces {} separated by commas. as such, this is currently broken for multi/all variable selection.

Not sure what has to be changed to fix the interpolation here, assuming this is just default behavior for plugins.

— Reply to this email directly, view it on GitHub https://github.com/fr-ser/grafana-sqlite-datasource/issues/88#issuecomment-1167499150, or unsubscribe https://github.com/notifications/unsubscribe-auth/ALIKO6ARXY6GWZREDL77F2DVRHMTVANCNFSM5ZQR4WFA . You are receiving this because you authored the thread.Message ID: @.***>

corto25 commented 2 years ago

@corto25, after playing around a bit with your requirements it seems to me that they are already working (with the time series option instead of a table option in case you haven't tried that yet). [...]

@fr-ser I had not noticed that option. It looks like my RFC is already supported. The only comment I would have is to avoid putting the value column name as prefix for univariate timeseries (ie instead of "value loadavg5", just putting "loadavg5" would be fine).

Also, I've done a quick experiment with multivariate + multi-series together and the labelling quickly become awkward. This here:

SELECT
  format("loadavg %d", avg_span_minutes) as label,
  unix_timestamp,
  value,
  value/2 as half

Intuitively I would expect 6 curves on the panel: "value loadavg1", "half loadavg1", and so on for loadavg5 and loadavg15. But the result is this:

half half loadavg1
half half loadavg15
half half loadavg5
value value loadavg1
value value loadavg15
value value loadavg5

I'm not sure if there's a way to control this; I haven't found one without overriding them individually. Also, this may be a matter of preference, but I would rather have them display as "loadavg1 value" and "loadavg1 half" as this will sort things together in a more relevant way (though this is where I suppose people could disagree).

I'll be closing this ticket, thank you.

corto25 commented 2 years ago

RESOLUTION: Feature is already supported. The dropdown menu that shows "Table" by default just below the Query Name (showing A, B, C, etc), when changed to "Time series" achieves the requirements of this RFC.