 alayek
commented
7 years ago
alayek
commented
7 years ago @QuincyLarson I will try to finish this off tomorrow.
Closed QuincyLarson closed 7 years ago
alayek
commented
7 years ago @QuincyLarson I will try to finish this off tomorrow.
 QuincyLarson
commented
7 years ago
QuincyLarson
commented
7 years ago @alayek awesome!
QuincyLarson
commented
7 years ago @alayek these are coming along great. Have you had a chance to finish these? Also, could you go through and add tests to these? We are ready to import these and start QA'ing them.
 HKuz
commented
7 years ago
HKuz
commented
7 years ago Here's a first draft of the D3 section Introduction. I'm not sure all the language is ESL friendly, so feedback there is appreciated. I figured since this section falls in the 4th overall segment of the curriculum, campers should be familiar with most of the concepts/vocab. Any thoughts or comments are welcome.
D3.js, or D3, stands for Data Driven Documents. D3 is a JavaScript library to create dynamic and interactive data visualizations in the browser. It's built to work with common web standards, namely HTML, CSS, and Scalable Vector Graphics (SVG).
D3 takes input data and maps it into a visual representation of that data. It supports many different data formats. D3 lets you bind (or attach) the data to the Document Object Model (DOM). You can use HTML or SVG elements with D3's built-in methods to transform the data into a visualization.
D3 gives you a lot of control over the presentation of data. This section covers the basic functionality and how to create visualizations with the D3 library.
HKuz
commented
7 years ago And I couldn't find an XKCD comic specifically addressing data visualization, but this one was a great example of it in practice 😄
QuincyLarson
commented
7 years ago Wow - that is an excellent description! I think it's pretty lay-person and non-native English speaker accessible, as well. Great job! Also, I hadn't seen that XKCD comic before. Yes - I agree that it's a good one to use 👏
HKuz
commented
7 years ago Cool, thanks @QuincyLarson - I'll drop it in the seed file in the next iteration 👍
QuincyLarson
commented
7 years ago Thanks for your help everyone! We've loaded these challenges into the seed files and plan to deploy them to beta as soon as possible.
I'm closing this issue. If anyone wants to discuss these further, please reopen it.
 manoj10101996
commented
4 years ago
manoj10101996
commented
4 years ago 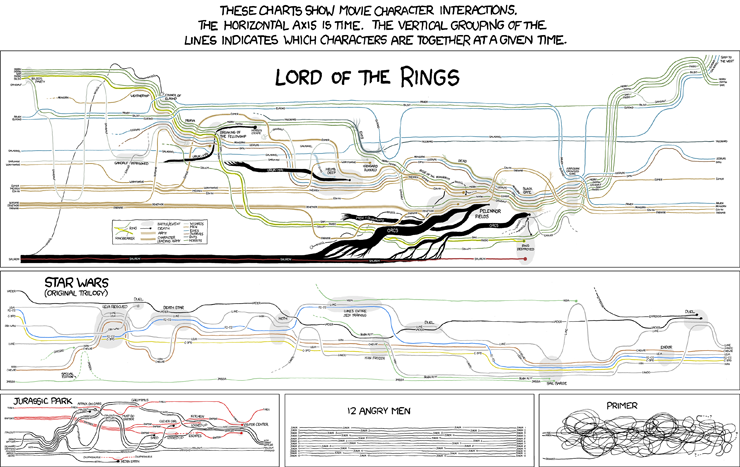
For each challenge, please reply to this GitHub issue with:
We still need to come up with a list of concepts to cover, where each topic can be taught interactively, then translate these concept into the names of the challenges.
Edit:
With inputs from @elibei, these are the topics we would like to cover under D3 [WIP]
d3.min()andd3.max()