 fremag
commented
7 years ago
fremag
commented
7 years ago There is a module named Referers that may be what you're looking for:
Closed kimsagro1 closed 7 years ago
 kimsagro1
commented
7 years ago
kimsagro1
commented
7 years ago This doesn't really help either

The program in its entirety is below if you want to have a look
using System;
using System.Collections.Generic;
using System.Linq;
using System.Text;
using System.Threading.Tasks;
using Yahoo.Yui.Compressor;

namespace ConsoleApp3
{
    class Program
    {
        static void Main(string[] args)
        {
            // import nuget package YUICompressor.NET
            new JavaScriptCompressor().Compress("var a;");
            Console.ReadLine();
        }
    }
}It looks like VS 2017 analyzes every path to root from string instances. I wrote Memoscope with VS 2015 and installed 2017 only a few weeks ago. Is this feature available with community edition or do you have a professional one ?
So, your question was: "is there anyway to get a breakdown of the various types that allocated these strings and how many they allocated." and I'm sorry the answer is "No".
Maybe in a MemoScope version 1.x, who knows...
fremag
commented
7 years ago Correct me if I'm wrong: you used the memory profiler from VS 2017, you did not dumped your process then opened it with Visual Studio ?
That's a major difference: MemoScope is not a memory profiler. It doesn't record anything at runtime (ie allocations), it just takes a snapshot of all the memory.
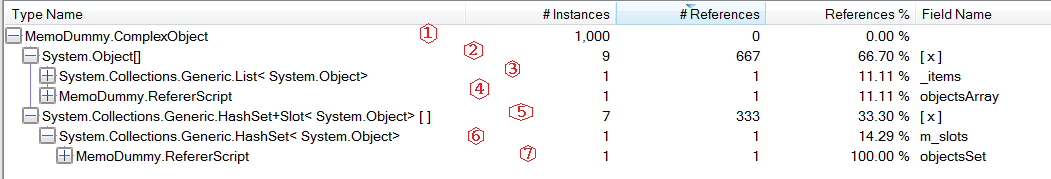
I made a screenshot of VS 2017 running your code with memory profiler activated and a dump file opened in MemoScope.

That's interesting, I wonder why it doesn't find the references from static variables.
kimsagro1
commented
7 years ago So the process was
1) I took a memory dump using task manager 2) I opened that dump file using vs2017 enterprise (double clicked on the .dmp file) 3) In the actions, clicked debug managed memory

4) Then clicked the little icon that appears when you hover over List<String>

5) Which shows this

fremag
commented
7 years ago Thanks a lot for the details. It looks like the memory dump features are only available in the (expensive) Enterprise edition of Visual Studio. And MemoScope is free and open source :)
If you know any other missing feature, please tell me, I'll see if I can add them (or merge any pull request from a fork)

From the Heap statistics screen, I can see that a number of strings have been allocated
However, is there anyway to get a breakdown of the various types that allocated these strings and how many they allocated.
For example if I open the dump file in visual studio 2017, I can see this information
Which tells me that the majority of string allocations are from a static
List<string>namedThreeson theYahoo.Yui.Compressor.JavaScriptCompressortypeThanks for this amazing project