First paint and first contentful paint (它在发生吗?)
FP 和 FCP 分别是页面首次绘制和首次内容绘制。首次绘制包括了任何用户自定义的背景绘制,它是首先将像素绘制到屏幕的时刻。首次内容绘制是浏览器将第一个 DOM 渲染到屏幕的时间。该指标报告了浏览器首次呈现任何文本、图像、画布或者 SVG 的时间。这两个指标其实指示了我们通常所说的白屏时间。
参考 api: https://w3c.github.io/paint-timing/
在控制台查看 paint 性能:
window.performance.getEntriesByType('paint')
在代码中查看 paint 性能:
const observer = new PerformanceObserver((list) => {
  for (const entry of list.getEntries()) {
    // `entry` is a PerformanceEntry instance.
    console.log(entry.entryType);
    console.log(entry.startTime);
    console.log(entry.duration);
  }
});

// register observer for long task notifications
observer.observe({entryTypes: ["paint"]});
ssr:
csr:
First meaningful paint and hero element timing(它是否有用?)
FMP(首次有意义绘制) 是回答“它是否有用?”的度量标准。因为很难有一个通用标准来指示所有的页面当前时刻的渲染达是否到了有用的程度,所以当前并没有制定标准。对于开发者,我们可以根据自己的页面来确定那一部分是最重要的,然后度量这部分渲染出的时间作为FMP。
前端性能量化标准
我们经常能看到大量介绍前端如何进行性能优化的文章。然而很多文章只介绍了如何优化性能,却未能给出一个可计算,可采集的性能量化标准。甚至看到一些文章,在介绍自己做了优化后的性能时,提到页面加载速度提升了多少多少,但是当你去问他你怎么测量性能的时,却不能给出一个科学的、通用的方法。
其实,在进行性能优化前,首先需要确定性能衡量标准。前端性能大致分为两块,页面加载性能和页面渲染性能。页面加载性能指的是我们通常所说的首屏加载性能。页面渲染性能指的是用户在操作页面时页面是否能流畅运行。滚动应与手指的滑动一样快,并且动画和交互应如丝般顺滑。这两种页面性能,都需要有可量化的衡量标准。
本文参考了谷歌提出的性能衡量方式。首先确定以用户体验为中心的性能衡量标准。然后,针对这些性能标准,制定采集性能数据的方法,以及性能数据分析方法。最后,结合性能量化标准,提出优化性能的方法。
页面加载性能
性能度量标准
下表是与页面加载性能相关的用户体验。
与用户体验相关,制定以下度量标准:
First paint and first contentful paint (它在发生吗?)
FP 和 FCP 分别是页面首次绘制和首次内容绘制。首次绘制包括了任何用户自定义的背景绘制,它是首先将像素绘制到屏幕的时刻。首次内容绘制是浏览器将第一个 DOM 渲染到屏幕的时间。该指标报告了浏览器首次呈现任何文本、图像、画布或者 SVG 的时间。这两个指标其实指示了我们通常所说的白屏时间。
参考 api: https://w3c.github.io/paint-timing/
在控制台查看 paint 性能:
在代码中查看 paint 性能:
ssr:

csr:

First meaningful paint and hero element timing(它是否有用?)
FMP(首次有意义绘制) 是回答“它是否有用?”的度量标准。因为很难有一个通用标准来指示所有的页面当前时刻的渲染达是否到了有用的程度,所以当前并没有制定标准。对于开发者,我们可以根据自己的页面来确定那一部分是最重要的,然后度量这部分渲染出的时间作为FMP。
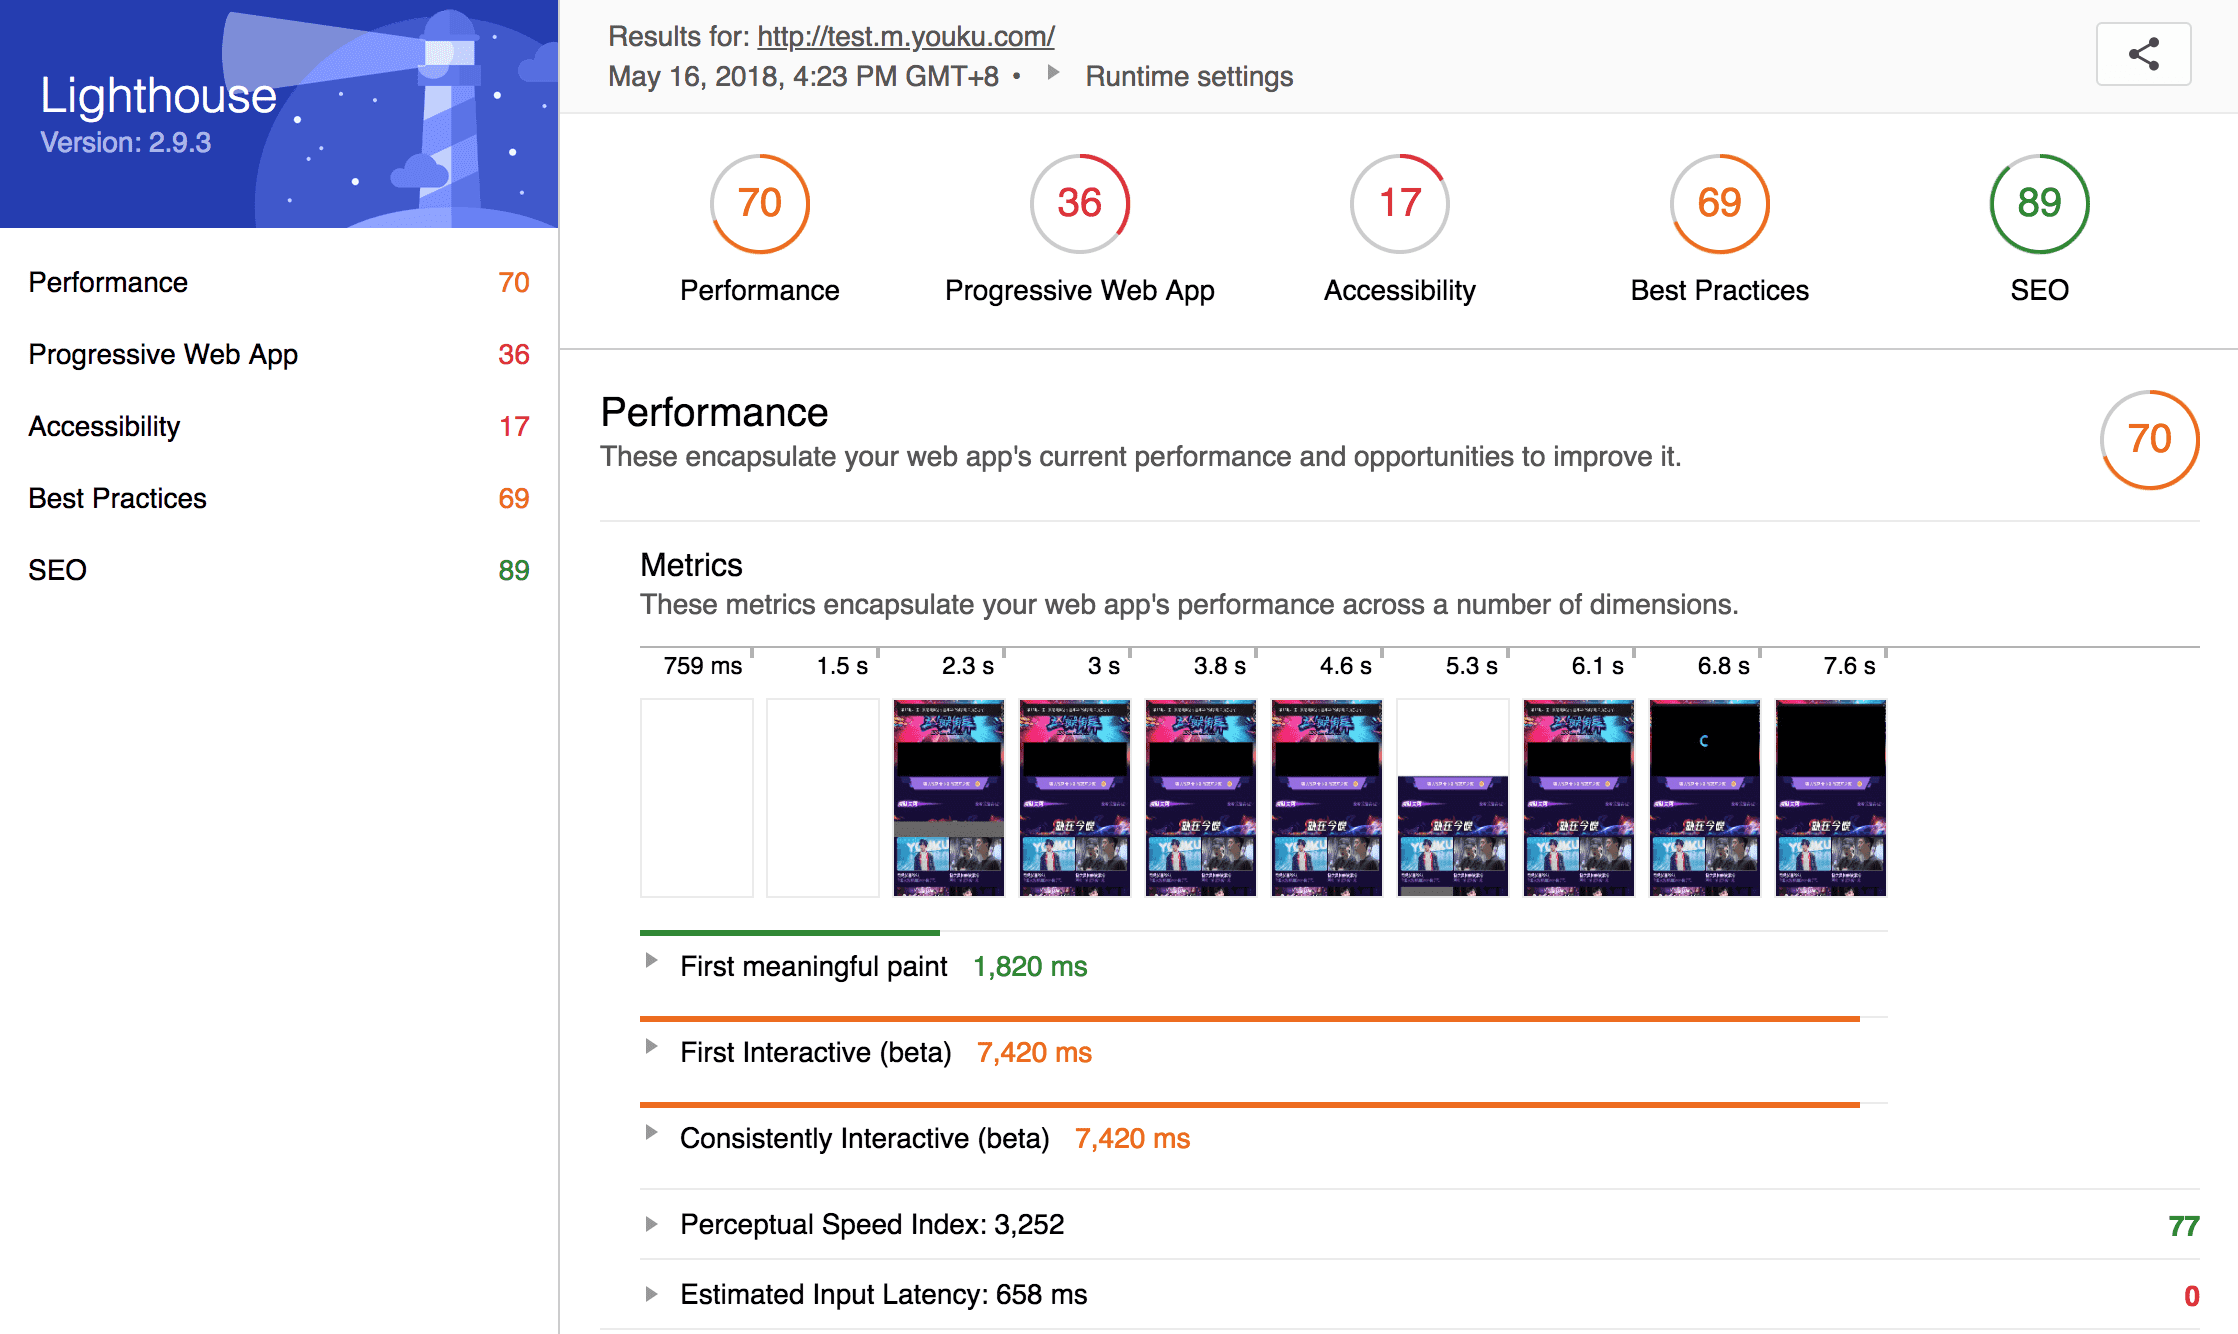
chrome 提供的性能分析工具 Lighthouse 可以测量出页面的 FMP,在查阅了一些资料后,发现 Lighthouse 使用的算法是:页面绘制布局变化最大的那次绘制(根据 页面高度/屏幕高度 调节权重)
参考:Time to First Meaningful Paint: a layout-based approach
ssr:
csr:
Long tasks(它是否令人愉快的?)
我们知道,js 是单线程的,js 用事件循环的方式来处理各个事件。当用户有输入时,触发相应的事件,浏览器将相应的任务放入事件循环队列中。js 单线程逐个处理事件循环队列中的任务。
如果有一个任务需要消耗特别长的时间,那么队列中的其他任务将被阻塞。同时,js 线程和 ui 渲染线程是互斥的,也就是说,如果 js 在执行,那么 ui 渲染就被阻塞了。此时,用户在使用时将会感受到卡顿和闪烁,这是当前 web 页面不好的用户体验的主要来源。
Lonag tasks API 认为一个任务如果超过了 50ms 那么可能是有问题的,它会将这些任务展示给应用开发者。选择 50ms 是因为这样才能满足RAIL 模型 中用户响应要在 100ms 内的要求。
Time to interactive(它是否可用?)
TTI(可交互时间) 指的是应用既在视觉上都已渲染出了,又可以响应用户的输入了。应用不能响应用户输入的原因主要包括:
TTI 指明了页面的 js 脚本都被加载完成且主线程处于空闲状态了的时间。
在用户设备中测量性能
下面是一段开发者经常用来 hack 检查页面中长任务的代码:
hack 方式存在一些副作用:
性能测量的代码最重要的准则是它不该使性能变差。
本地开发时性能的测量
Lighthouse 和 Web Page Test 为我们本地开发提供了非常好的性能测试工具,而且对于我们前面提到的各项测量标准都有较好的支持。但是,这些工具不能在用户的机器上运行,所以它们不能反映用户真实的用户体验。
用户设备中性能的测量
幸运的是,随着新 API 的推出,我们可以再用户设备上测量这些性能而不需要付出用可能使性能变差的 hack 的方式。
这些新的 API 是 PerformanceObserver, PerformanceEntry, 以及 DOMHighResTimeStamp。
标准中并未定义 FMP,我们需要根据页面的实际情况来定 FMP。一个较好的方式是测量页面关键元素渲染的时间。参考文章 User Timing and Custom Metrics。
测量 css 加载完成时间:
测量关键图片加载完成时间:
测量文字类元素加载完成时间:
计算加载时间:
采用谷歌提供的 tti-polyfill。
TTI 标准定义文档
数据分析
当我们收集了用户侧的性能数据,我们需要把这些数据用起来。真实用户性能数据是十分有用的,原因包括:
下面是一个用图表来分析数据的例子:
这个例子展示了 PC 端和移动端的 TTI 分布。可以看到移动端的 TTI 普遍长于 PC 端。
PC 端:
移动端:
对这些图表使的分析得我们能快速地了解到真实用户的体验。从上面的表格我们能看到,10% 的移动端用户在 12s 后才能开始页面交互!
性能是如何影响商业的
利用用户侧性能数据,我们可以分析性能是如何影响商业的。例如,如果你想分析目标达成率或者电商转化率:
如果证明他们之间是有关联的,那么这就很容易阐述性能对业务的重要性,且性能是应该被优化的。
放弃加载
我们知道,如果页面加载时间过长,用户就会经常选择放弃。不幸的是,这就意味着我们所有采集到的性能数据存在着幸存者偏差——性能数据不包括那些因为放弃加载页面的用户(一般都是因为加载时间过长)。
统计用户放弃加载会比较麻烦,因为一般我们将埋点脚本放在较后加载。用户放弃加载页面时,可能我们的埋点脚本还未加载。但是谷歌数据分析服务提供了Measurement Protocol 。利用它可以进行数据上报:
需要注意的是,在页面加载完成后,我们要移除监听,因为此时监听用户放弃加载已经没有意义,因为已经加载完成。
优化页面加载性能
我们定义了以用户为中心的性能量化标准,就是为了指导我们优化性能。
最简单的优化性能的方式是减少需要传输给客户端的 js 代码。但是如果我们已经无法缩小 js 代码体积,那就需要思考如何传输我们的 js 代码。
优化 FP/FCP
<head>移除影响 FP/FCP 的 css 和 js 代码<head>中优化 FMP/TTI
防止 long tasks
页面渲染性能
TODO:
其他性能测量方式
Navigation Timing
load 事件与 DOMContentLoaded 事件
DOMContentLoaded 事件
当初始的 HTML 文档被完全加载和解析完成之后,DOMContentLoaded 事件被触发,而无需等待样式表、图像和子框架的完成加载。
load 事件
当页面资源及其依赖资源已完成加载时,将触发load事件。当 onload 事件触发时,页面上所有的DOM,样式表,脚本,图片都已经加载完成了。
顺序是:DOMContentLoaded -> load。
单纯地用 load 事件或者 DOMContentLoaded 事件来衡量页面性能,并不能很好地反馈出站在用户角度的页面性能。