 fzyzcjy
commented
1 year ago
fzyzcjy
commented
1 year ago Looks interesting!
it just wrap each of your functions with a wrapping function for benchmark.
Oops next time maybe create an issue first :/ Because frb already has a feature: Wrap a specific call with whatever code you like. For example, in my own app using frb, I call print both before and after a specific call, and also record the time spent in that call.
It can be easily completely opted-out, by installing FRB codegen without feature benchmarking
Would be great to not use a feature, since most people will download a prebuilt binary instead of building his own
 Roms1383
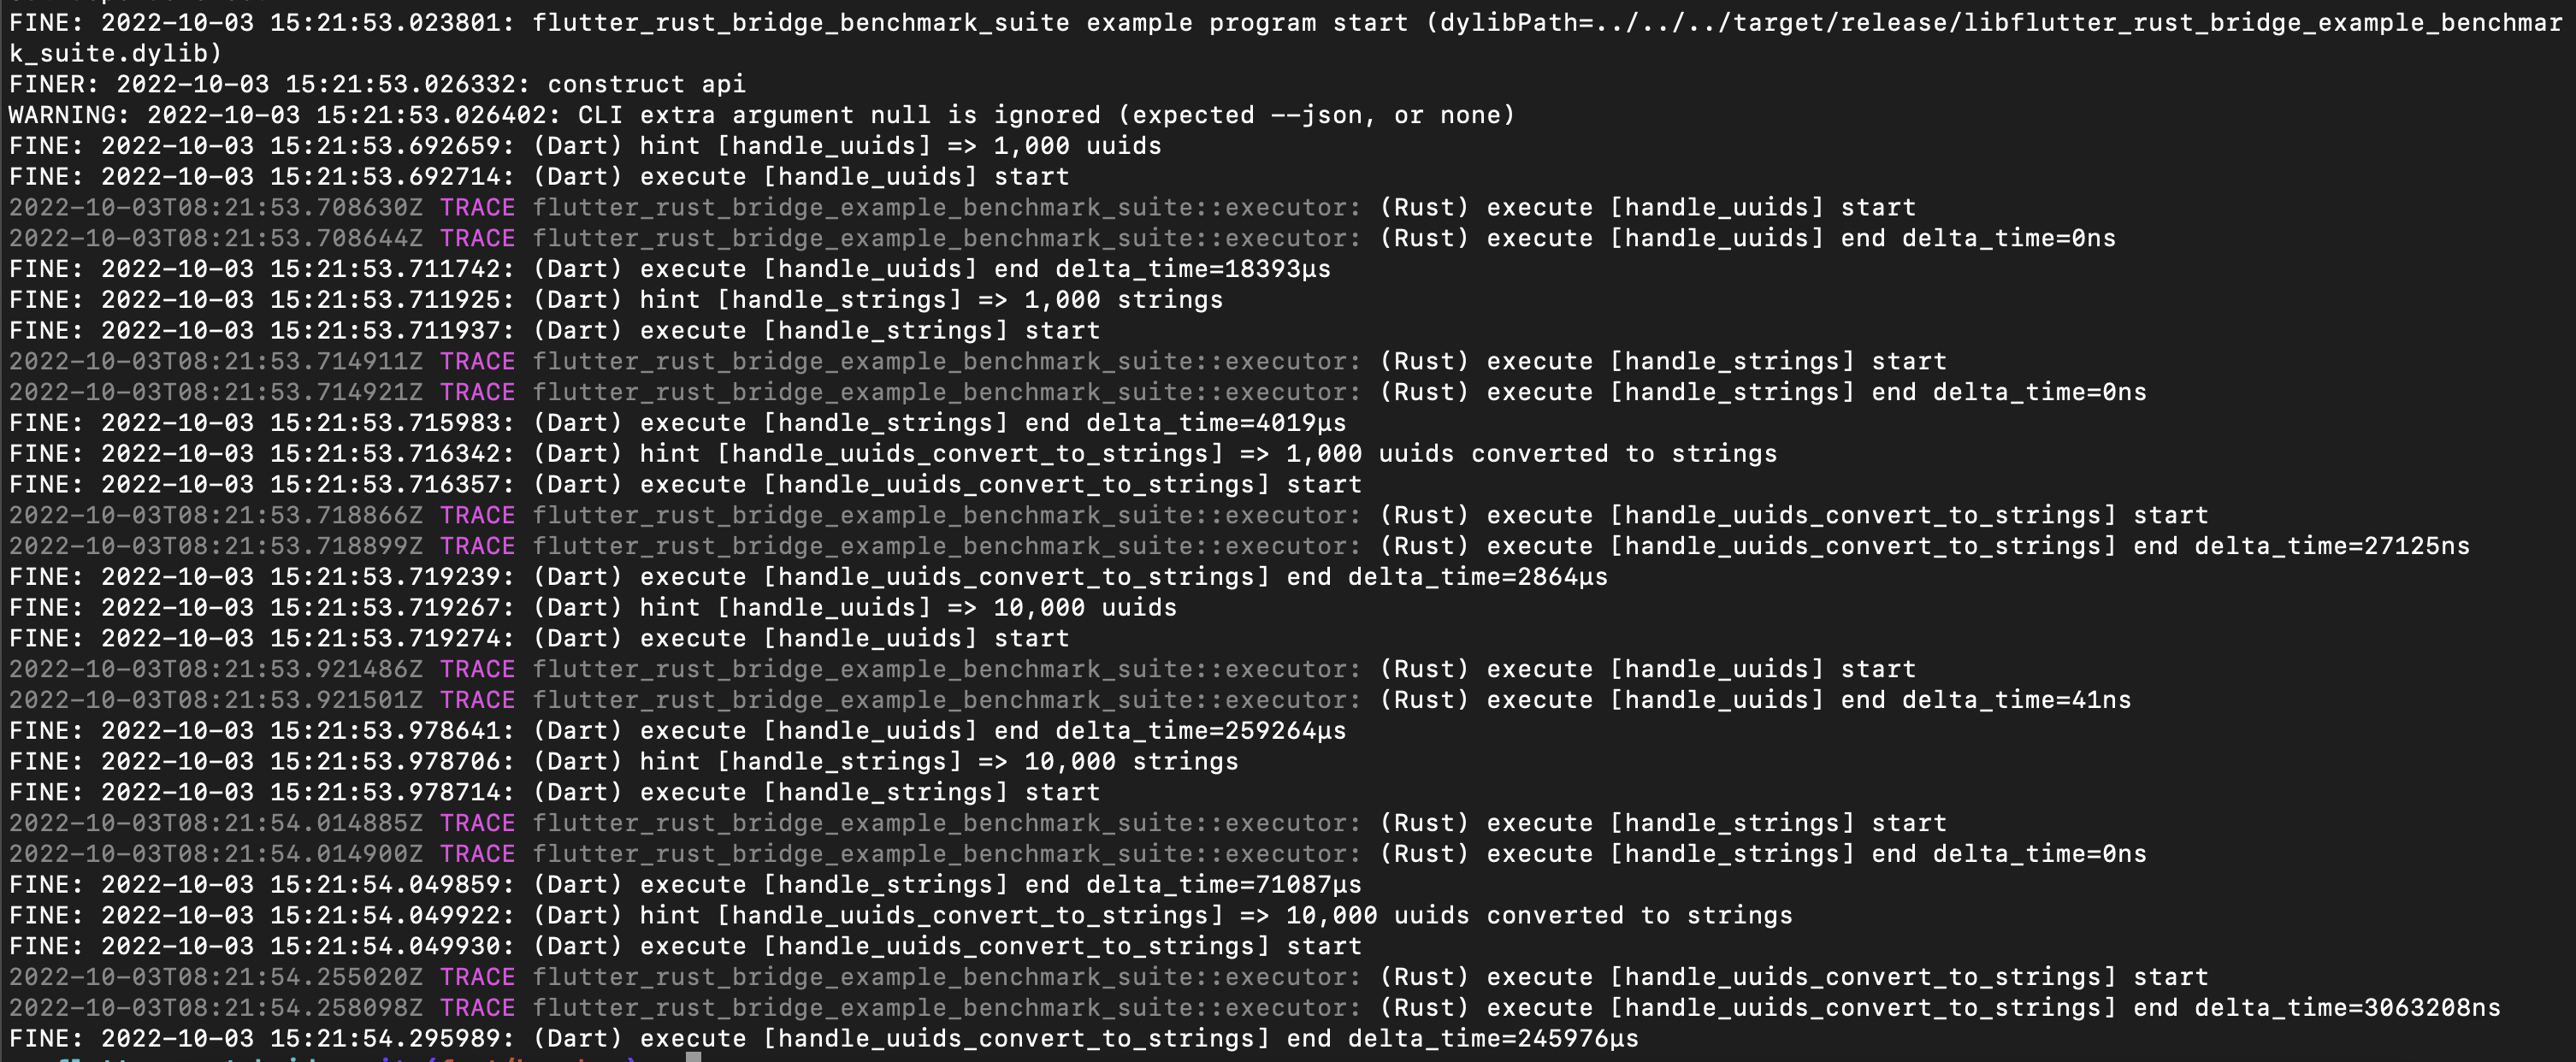

 Desdaemon
Hi ! This feature is still a work a progress, but already quite advanced
Checklist
./frb_example/pure_dartexample, more specifically,rust/src/api.rsanddart/lib/main.dart.just refresh_all)../bookfolder) are updated.Remark for maintainer
So I was looking to provide an elegant way to benchmark the cost of sending over FFI and here it goes.
It's implementation is simplistic on purpose : it just wrap each of your functions with a wrapping function for benchmark. This feature doesn't try to teach how you should do your benchmarks, it just avoids you the boilerplate that you would otherwise write by hand (and follow general FRB philosophy). It doesn't pretend that tests will be the most accurate, this is still on your hands and depends on how you set them up :)
On all platform except
web, it uses TimelineTask under the hood : there's now additional shortcut commands to run e.g. your tests, while setting pause to allow you to peek at the results in Dart DevTools. Onwebplatform, it uses Stopwatch instead, so the results will directly be printed out to the console.It can work in your tests, as can be seen in
frb_example/pure_dart/dart/lib/main.dart(even if technically performance shouldn't be measured while running tests to get the most accurate results, but if it's just to compare functions with another, then it can still provide some useful insight). A traditional test with benchmark_harness is also provided, to compare the results if needed.It can be easily completely opted-out, by installing FRB codegen without feature
benchmarking. It can also be installed while still being disabled whenever needed, by settings CLI argsbench-extendedto false.So far the only tasks left are :