gazebosim / gz-gui

Builds on top of Qt to provide widgets which are useful when developing robotics applications, such as a 3D view, plots, dashboard, etc, and can be used together in a convenient unified interface.
https://gazebosim.org
Apache License 2.0
74 stars 43 forks source link

Mesh/material memory leak #208

Open AndrejOrsula opened 3 years ago

AndrejOrsula commented 3 years ago

Maybe related to https://github.com/ignitionrobotics/ign-rendering/issues/39

After investigating this issue more, it is more suited to be inside https://github.com/ignitionrobotics/ign-rendering as it occurs for both GUI and camera sensors. Please move the issue there if possible.

Environment

Description

I should note that this behaviour might be advantageous for headless simulation if an environment repeatedly utilises a limited number of models, as reinsertion of a model is much faster if its resources already loaded to memory. Duality of bug/feature is real with this one. Therefore, having an option to allow both behaviours might be preferable, i.e option A - unload all resources after removing model, option B - keep the resources (with some policy that makes sure the system does not run out of memory/exceed some threshold).

Steps to reproduce

  1. ign gazebo -s
  2. ign gazebo -g
  3. Open RAM usage monitor of your choice. Optionally, monitor VRAM usage as well.
  4. Run the following example script ign_gui_memory_leak_reproducibility_script.bash (gist)
    • This script iteratively inserts and removes models with mesh geometry and material texture using service calls
    • Note: Script downloads models from Fuel (total of ~650MB)
    • Note: About ~4GB RAM will be leaked with the utilised 50 models
      ign_gui_memory_leak_reproducibility_script.bash
#!/usr/bin/env bash

## Get list of first <n_models> models from <owner> (using Fuel)
owner="googleresearch"
n_models=50 # 50 corresponds to ~650MB disk usage and ~4GB RAM (leaked) usage, use less if your system does not allow it
echo "Getting list of '$n_models' models owned by '$owner'. This might take few minutes during the first execution... Please be patient :)"
model_names=$(ign fuel list -o $owner -t model -r | head -n $n_models | sed -n -e 's/^.*models\///p')

## Download models if needed (done separately because "/world/default/create" service might timeout)
for model_name in $model_names; do
    if [[ ! -d "$HOME/.ignition/fuel/fuel.ignitionrobotics.org/$owner/models/$model_name" ]]; then
        model_uri="https://fuel.ignitionrobotics.org/1.0/$owner/models/$model_name"
        echo "Downloading model '$model_uri'"
        ign fuel download -t model -u "$model_uri" &
    fi
done
for job in $(jobs -p); do
    wait $job
    echo "Model downloaded"
done

world_name="default"
# world_name="camera_sensor"
for model_name in $model_names; do
    ## Spawn model
    echo "Spawning model $model_name"
    model_uri="https://fuel.ignitionrobotics.org/1.0/$owner/models/$model_name"
    ign service -s "/world/$world_name/create" --timeout 5000 \
        --reqtype ignition.msgs.EntityFactory \
        --reptype ignition.msgs.Boolean \
        -r 'sdf_filename: "'$model_uri'" name: "'$model_name'"' 1>/dev/null
    sleep 0.5
    ## Remove model
    echo "Removing model $model_name"
    ign service -s "/world/$world_name/remove" --timeout 5000 \
        --reqtype ignition.msgs.Entity \
        --reptype ignition.msgs.Boolean \
        -r 'type: 2 name: "'$model_name'"' 1>/dev/null
    echo ""
done

Service calls are used here to easy reproducibility. This issue occurs also when using C++ API directly (I originally experienced the issue while using gym-ignition).

Output

Below is a video of performing the steps above. Notice also that the aligned bounding boxes of objects remain visible if object was removed while selected (and they cannot be removed). Speculation: This might be the small negligible amount of memory that accumulates on model reinsertion for GUI (or part of it).

https://user-images.githubusercontent.com/22929099/113486605-00994180-94b4-11eb-8945-597deb17d6c7.mp4

I tried to investigate the issue with Heaptrack, however, only a fraction of the leaked memory gets logged (as far as I can see). Peak resident memory (RSS) matches the total RAM usage (4.8GB), but I was not able to figure out what the largest contributor is. The mesh/texture data is not logged. I am not sure if it's caused by having Ruby in the loop or because rendering engine is loaded as plugin?

Log file: heaptrack.ruby.3172402.gz

Summary: heaptrack_ign_gui_memory_leak

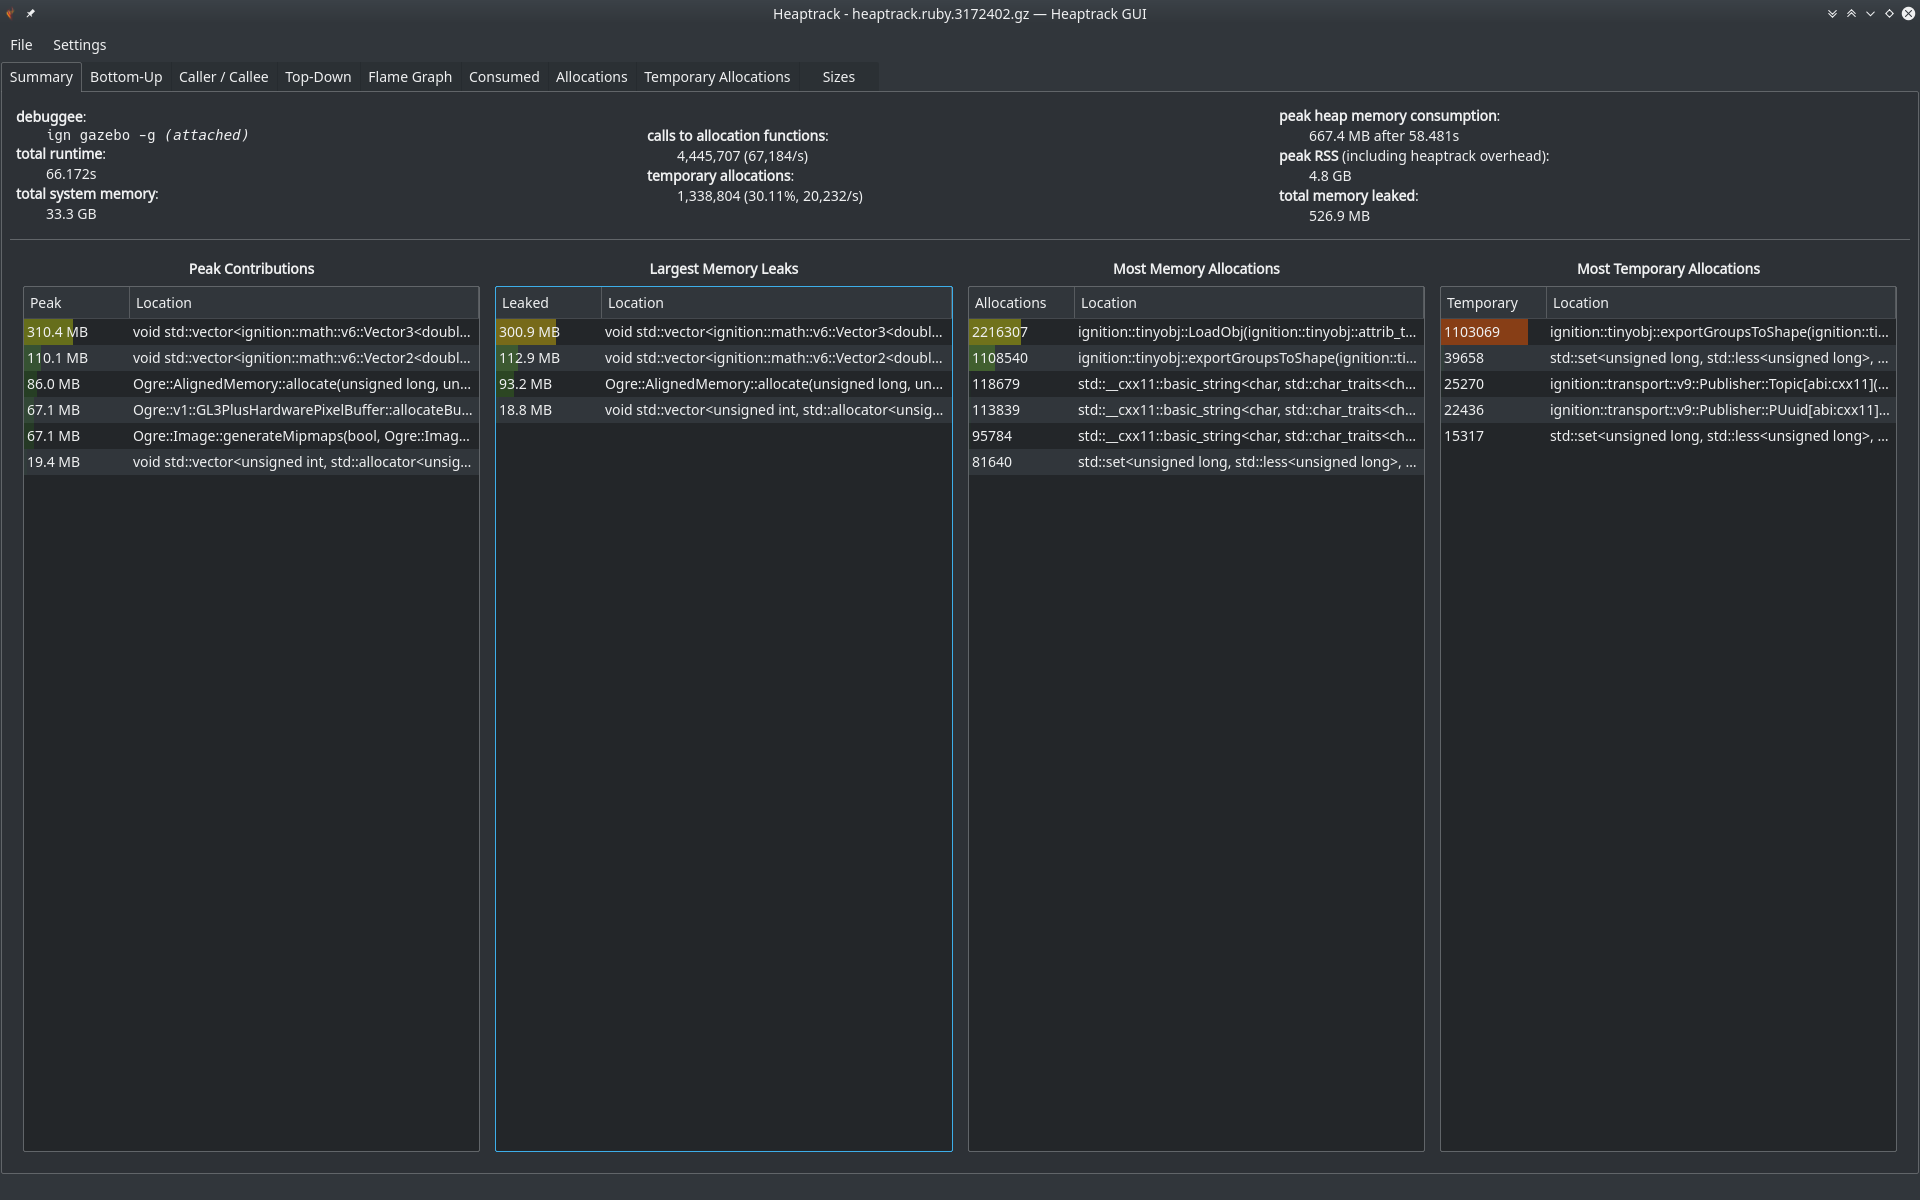
Consumption (each spike is insertion of a new model): heaptrack_ign_gui_memory_leak_consumed

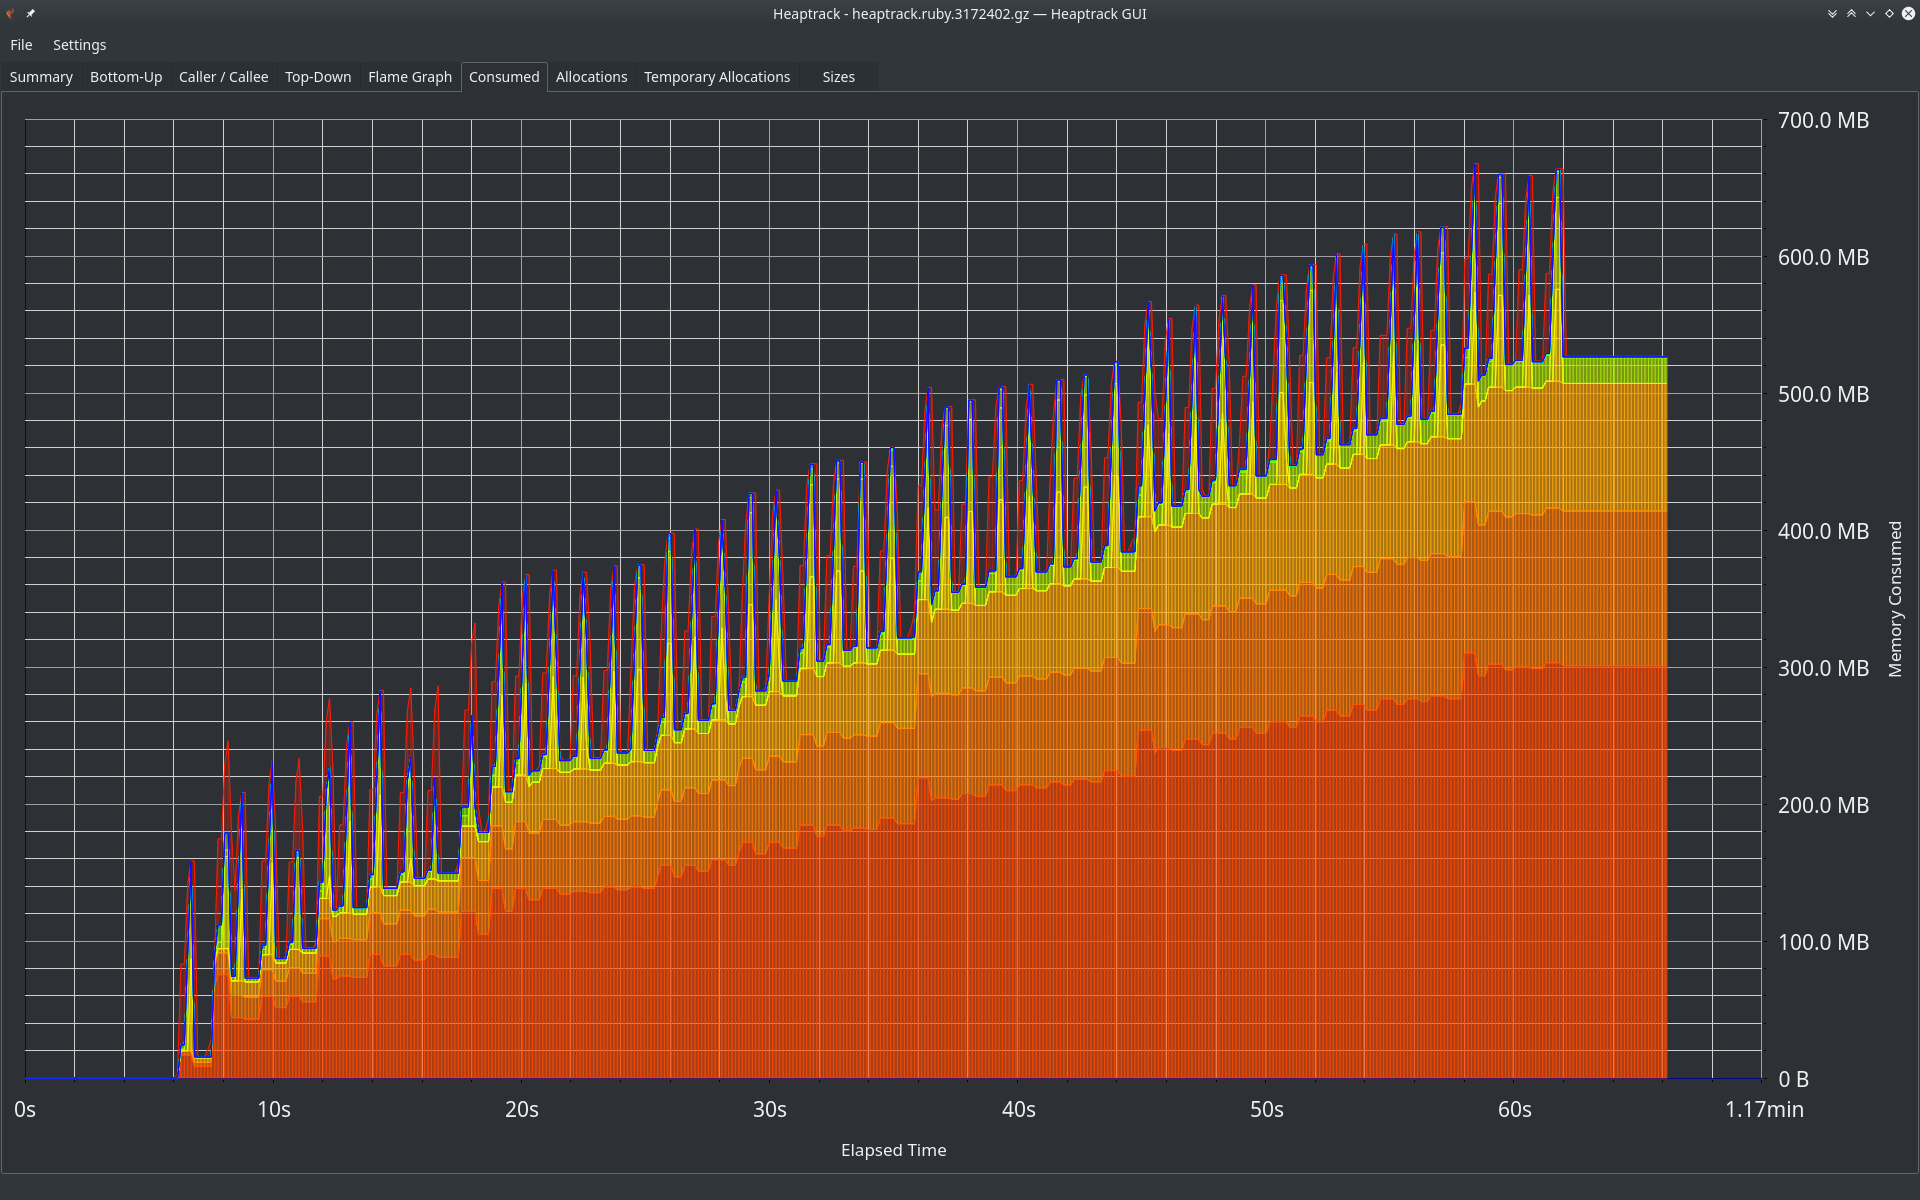
Overlapping collision geometries

While making the reproducibility example, I also noticed that if I resume the simulation after all the model insertions/deletions, the server freezes completely and outputs a bunch of ODE collision-related messages. I have seen these before when two or more models have their collision geometry largely overlapping. Therefore, it seems the collision geometry is not immediately removed from server when the simulation is paused. Is this a design choice or a bug?

ODE Message 2: Trimesh-trimesh contach hash table bucket overflow - close contacts might not be culled in AddContactToNode() [collision_trimesh_trimesh.cpp:224]
AndrejOrsula commented 3 years ago

There is actually a memory leak inside server too, but at much smaller scale. Using the same procedure, here is a Heaptrack of ign gazebo -sr.

Log file: heaptrack.ruby.2904453.gz

Summary: heaptrack_ign_gazebo_server

Consumption: heaptrack_ign_gazebo_server_consumed

AndrejOrsula commented 3 years ago

Investigating further, the full issue occurs also for camera sensors totalling to ~5GB memory leaked (headless), and adding up to ~10GB leaked for 50 models if GUI is also opened. Therefore, the issue might be inside ign-rendering after all. Heaptrack for ign gazebo camera_sensor.sdf -sr is below (sorry for spam)

Log file: heaptrack.ruby.2949814.gz

Summary: heaptrack_ign_sensors

I updated the issue description to reflect this discovery.

ahcorde commented 3 years ago

I have been digging a little bit more about this problem and I think I found the source.

There are two places where we handle meshes


The first thing to take in account is that we don't have a method in the MeshManager Class to remove meshes, this will make imposible to delete some kind of memory

I made a simple C++ example to load and destroy some meshes using only the MeshManager (I added a method to remove them, I will create the PR soon). And as you can see in the following image we are able to destroy the memory properly.

Selección_089


The problem is inside ign-rendering, when we destroy the mesh using this new method there is no call to destroy the Ogre material which in this particular case will contain a texture image (quite big) which makes the memory to growth but we are not cleaning this up.

In the following image we can see how we create the meshes and at the end I try to destroy then but we are only able to destroy the memory in the MeshManager but not in ign-rendering.

Selección_090

TODO

FYI @iche033

ahcorde commented 3 years ago

Some more details:

We have some duplicated materials. When we create the mesh and we load the material in memory in particular in this methos bool OgreMeshFactory::LoadImpl(const MeshDescriptor &_desc). We create "general " Material which is passed to the submeshes, I think this is because we can have some submeshes with the same material but with different properties.

Then when we try to remove the mesh which potencially has some submeshes with textures we are going to remove the texture associated with the submesh but we are not removing this general material which will live in the memory forever or when we remove the engine with the method Destroy.

ahcorde commented 3 years ago

I added this PR in ign-gazebo https://github.com/ignitionrobotics/ign-gazebo/pull/824 that allows to remove the mesh when an entity is removed or the UserCommand remove is called.

The following image shows how the memory is removed

Selección_092

NOTE. This is using a world without any sensors. Which means the materials are not loaded, and there is no leak.

ahcorde commented 3 years ago

I openned this other draft PR https://github.com/ignitionrobotics/ign-rendering/pull/324

With this one we should be able to remove the material from the memory there are still a memory leak which I'm not able to identify.

Server

Selección_096

Client

Selección_097


NOTE As you can see in both cases there is a small memory leak.

ahcorde commented 3 years ago

The small memory leak is solved:

Server

Client

According with an offline discussion with @iche033, These changes may affect the performance in some special cases such us:

diegoferigo commented 3 years ago

Awesome catch @AndrejOrsula! I also experienced in the past the same behavior in a similar setting, but without debugging it this much, I ended up to an implementation where the simulator is completely destroyed and re-created every time. This of course introduces a non-negligible computation overhead, but in my experience:

@ahcorde really a great work! Just to know, do the models you tested have plugins?

ahcorde commented 3 years ago

@diegoferigo,

I'm using the models from the script that @AndrejOrsula included in the issue (googleresearch). I don't think these models include any kind of plugins.

diegoferigo commented 3 years ago

Ok thanks for the clarification, I found the script only now. Again, nicely done :tada: Very likely meshes have a much greater impact on memory than plugins. This fix made my day :)

AndrejOrsula commented 3 years ago

Thank you for investigating and mitigating this issue @ahcorde!

According with an offline discussion with @iche033, These changes may affect the performance in some special cases such us:

  • When repeatedly spawning large models in ignition
  • A world with hundreds of the same model

This is very true. From my experience, it is currently much faster to spawn a model with mesh geometry and image texture if its assets are already loaded to the memory. I don't have specific numbers, but it is especially noticeable for high-res textures (even if stored on SSD).

This behaviour is definitely beneficial if a limited number of diverse models is used. Currently, the only problem that really occurs is when a system runs out of RAM.

I forgot to mention in the original description that utilised VRAM is kept at a steady size just few MB below the available size (at least for CUDA). I assume it is due to some form of smart buffer poll management in OpenGL/OGRE? Having a similar solution for RAM would allow to keep the advantage of faster re-insertion of models while addressing the issue with lack of memory. I have no idea about the feasibility of such implementation, but having a maximum memory limit for assets (especially textures) would definitely be nice - with some policy that would free old and unused data [limit default to system memory].

ntfshard commented 3 months ago

Hello everyone I also faced with a memory leak problem and after several experiments I noticed that memory leaking by a small amount with some consistent speed even if I'm running empty simulation. (I know that this thread is quite old and something already changed) With valgrind and very raw xml report viewer and quite frequently saw a traces which ends inside QtQml library:

{"obj":"/usr/local/libexec/valgrind/vgpreload_memcheck-amd64-linux.so","fn":"operator new[](unsigned long)","dir":"/root/valgrind-3.23.0/coregrind/m_replacemalloc","file":"vg_replace_malloc.c","line":729}
{"obj":"/root/qtbase/lib/libQt5Qml.so.5.15.14","fn":"QQmlContextData::initFromTypeCompilationUnit(QQmlRefPointer<QV4::ExecutableCompilationUnit> const&, int)"}
{"obj":"/root/qtbase/lib/libQt5Qml.so.5.15.14","fn":"QQmlObjectCreator::create(int, QObject*, QQmlInstantiationInterrupt*, int)"}
{"obj":"/root/qtbase/lib/libQt5Qml.so.5.15.14","fn":"QQmlComponentPrivate::beginCreate(QQmlContextData*)"}
...

(I also saw some other problems, not related to Qt, but seems they are constant memory leak, not increasing)

And on a Qt bugtracker there is a bug https://bugreports.qt.io/browse/QTBUG-119301 with quite similar reference to my observation with initFromTypeCompilationUnit() (or at least IMHO)

QQmlObjectCreator class seems quite complex, and I can't find a place where context data member are should be destroyted (actually it should be called context->destroy() method afaiu), but maybe it shared with something. Screenshot 2024-06-11 at 20 22 22 (Qt 5.15.14, built from source; Ubuntu22 has 5.15.3 I guess, with similar result AFAIR)

Not sure how this observation can exactly help, but just in case I decide to share it. Tested on gz-gui7_7.2.2 tag. Please take it with grain of salt C: