 gboeing
commented
6 years ago
gboeing
commented
6 years ago @kuanb nice. How did you parameterize edge_buff and node_buff for the example image?
Closed kuanb closed 6 years ago
gboeing
commented
6 years ago @kuanb nice. How did you parameterize edge_buff and node_buff for the example image?
 kuanb
commented
6 years ago
kuanb
commented
6 years ago Those are both buffered at 25 (meters).
In the final example at the bottom of http://kuanbutts.com/2017/12/16/osmnx-isochrones/ I use 25 on edges and 50 on nodes (the above defaults).
gboeing
commented
6 years ago I like how the blocks are filled-in in your example image above. But, I'm not seeing the same results when I parameterize your sample code that way:
def make_iso_polys(G, edge_buff=25, node_buff=50):
    isochrone_polys = []
    for trip_time in sorted(trip_times, reverse=True):
        subgraph = nx.ego_graph(G, center_node, radius=trip_time, distance='time')

        node_points = [Point((data['x'], data['y'])) for node, data in subgraph.nodes(data=True)]
        nodes_gdf = gpd.GeoDataFrame({'id': subgraph.nodes()}, geometry=node_points)
        nodes_gdf = nodes_gdf.set_index('id')

        edge_lines = []
        for n_fr, n_to in subgraph.edges():
            f = nodes_gdf.loc[n_fr].geometry
            t = nodes_gdf.loc[n_to].geometry
            edge_lines.append(LineString([f,t]))

        n = nodes_gdf.buffer(node_buff).geometry
        e = gpd.GeoSeries(edge_lines).buffer(edge_buff).geometry
        all_gs = list(n) + list(e)
        new_iso = gpd.GeoSeries(all_gs).unary_union
        isochrone_polys.append(new_iso)
    return isochrone_polys
isochrone_polys = make_iso_polys(G, edge_buff=25, node_buff=25)
fig, ax = ox.plot_graph(G, fig_height=8, show=False, close=False, edge_color='k', edge_alpha=0.2, node_color='none')
for polygon, fc in zip(isochrone_polys, iso_colors):
patch = PolygonPatch(polygon, fc=fc, ec='none', alpha=0.6, zorder=-1)
ax.add_patch(patch)
plt.show()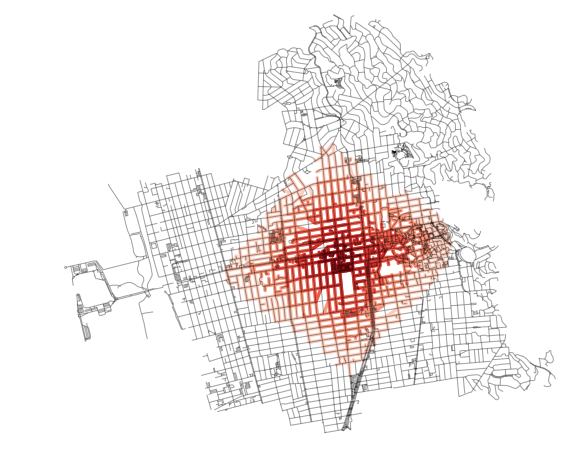
Does it make sense for 25-meter buffers to fill in the blocks, as seen in your image? They are much larger than 25x25 meters, so this output I'm seeing makes sense with those parameters.
kuanb
commented
6 years ago So sorry and thanks for pointing this out. I updated the post and also am including the fixed script here. I forgot to add on step to the method. I acknowledge this won't always work if you have a "donut" situation. Would need to think about a better way to handle such situations...
def make_iso_polys(G, edge_buff=25, node_buff=50, infill=False):
    isochrone_polys = []
    for trip_time in sorted(trip_times, reverse=True):
        subgraph = nx.ego_graph(G, center_node, radius=trip_time, distance='time')

        node_points = [Point((data['x'], data['y'])) for node, data in subgraph.nodes(data=True)]
        nodes_gdf = gpd.GeoDataFrame({'id': subgraph.nodes()}, geometry=node_points)
        nodes_gdf = nodes_gdf.set_index('id')

        edge_lines = []
        for n_fr, n_to in subgraph.edges():
            f = nodes_gdf.loc[n_fr].geometry
            t = nodes_gdf.loc[n_to].geometry
            edge_lines.append(LineString([f,t]))

        n = nodes_gdf.buffer(node_buff).geometry
        e = gpd.GeoSeries(edge_lines).buffer(edge_buff).geometry
        all_gs = list(n) + list(e)
        new_iso = gpd.GeoSeries(all_gs).unary_union

        # If desired, try and "fill in" surrounded
        # areas so that shapes will appear solid and blocks
        # won't have white space inside of them
        if infill:
            new_iso = Polygon(new_iso.exterior)
        isochrone_polys.append(new_iso)
return isochrone_polysHere's the result of the following script:
isochrone_polys = make_iso_polys(G, 25, 0, True)

fig, ax = ox.plot_graph(G, fig_height=8, show=False, close=False, edge_color='k', edge_alpha=0.2, node_color='none')
for polygon, fc in zip(isochrone_polys, iso_colors):
    patch = PolygonPatch(polygon, fc=fc, ec='none', alpha=0.6, zorder=-1)
    ax.add_patch(patch)
plt.show()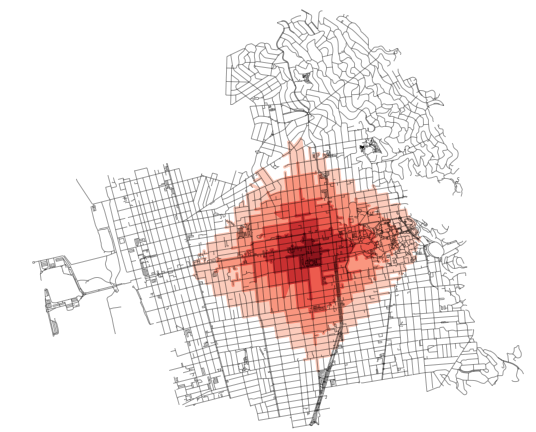
gboeing
commented
6 years ago thanks @kuanb I've added a demo of this to the notebook!
Regarding this example: https://github.com/gboeing/osmnx-examples/blob/master/notebooks/13-isolines-isochrones.ipynb
I propose a new method,
make_iso_polys, outlined below. This, rather than a convex hull, might best demonstrate coverage area while preserved nuances ("inlets" or areas of inaccessibility not captured when creating a convex hull around a point cloud).Example of what improved plot looks like: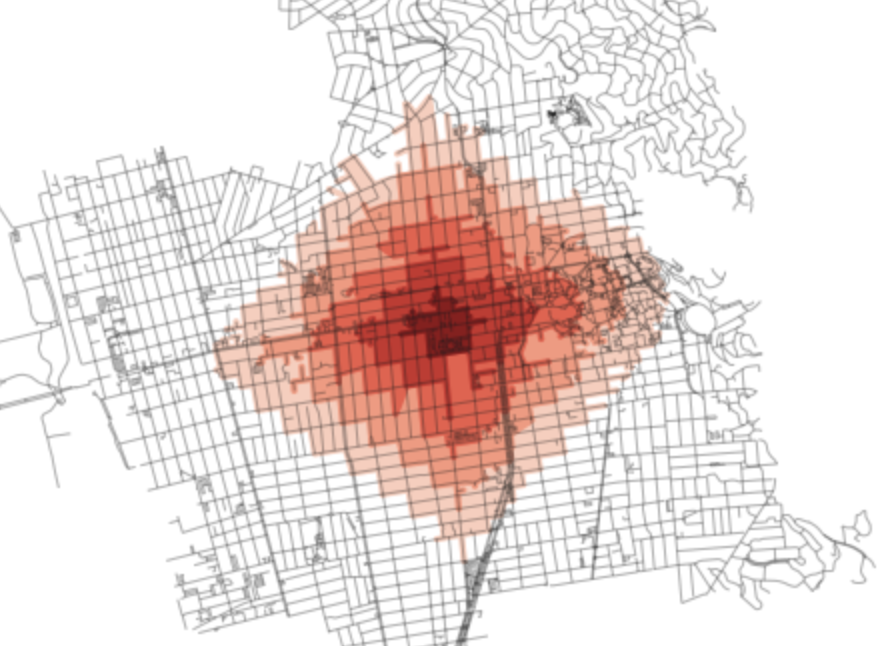
Ful function defintion.
Further elaboration available here: http://kuanbutts.com/2017/12/16/osmnx-isochrones/