 Robinlovelace
commented
3 months ago
Robinlovelace
commented
3 months ago Weird, I have no idea what's causing that.
Open michaeldorman opened 3 months ago
Robinlovelace
commented
3 months ago Weird, I have no idea what's causing that.
Robinlovelace
commented
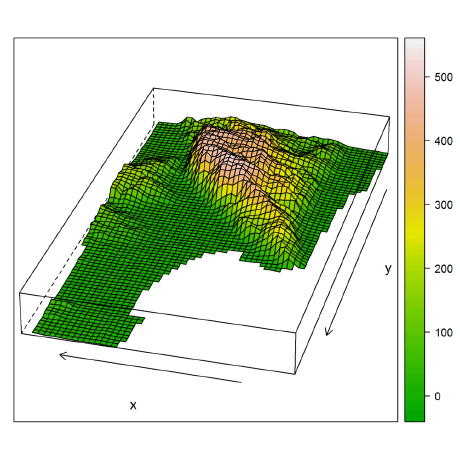
3 months ago Stretched on my computer at https://py.geocompx.org/03-spatial-operations#fig-raster-slope also.
 michaeldorman
commented
3 months ago
michaeldorman
commented
3 months ago Maybe the quarto version on GitHub is different? Just a thought
michaeldorman
commented
3 months ago P.S. The image files themselves are fine, but in the GitHub version for some reason the <img> height HTML property is being set to a specific value, therefore the images appear stretched:
In the local version height isn't set so the images look fine:
So again my only idea is to re-install quarto or check it's settings on GitHub (don't know how to do that, will be happy if you can please help)
Robinlovelace
commented
3 months ago Maybe the quarto version on GitHub is different? Just a thought
Yes, that could be it. Will update Quarto version and check again.
Robinlovelace
commented
3 months ago However, probably won't be until next week sorry, will asign myself as reminder.
michaeldorman
commented
3 months ago Thanks @Robinlovelace
michaeldorman
commented
3 months ago Apparently the issue is exactly the opposite, my local quarto was old :-) After installing the new version today, the figures are stretched locally too for me...
michaeldorman
commented
3 months ago @Robinlovelace does it make sense to use quarto 1.3 on GitHub actions, at least as a temporary solution?
 Nowosad
commented
3 months ago
Nowosad
commented
3 months ago Quarto <1.5 has this bug btw -- https://github.com/geocompx/geocompy/issues/224#issuecomment-2122388111
Robinlovelace
commented
3 months ago Upstream fix: https://github.com/geocompx/docker/issues/48
Robinlovelace
commented
3 months ago Let's see if latest commit in geocompy fixes it...
Robinlovelace
commented
3 months ago Still doesn't seem to be fixed, sorry. Let's leave it a few more commits to ensure Docker and website is updated, we can fix in the geocompy .yml file if that doesn't do it.
Robinlovelace
commented
3 months ago Update on this: I think it is a Quarto bug, but that that bug persists after v1.5.41:
That is reproducible from inside the latest version of the image defined in our .devcontainer file.
Robinlovelace
commented
3 months ago Optimistically closed with upstream commit, let's see if it actually fixes it!
michaeldorman
commented
3 months ago Hope so, thanks @Robinlovelace !
Robinlovelace
commented
2 months ago Minor update, can reproduce in devcontainer, going to try with latest version of quarto..
Robinlovelace
commented
2 months ago I think the best solution would be an upstream fix: https://github.com/quarto-dev/quarto-cli/issues/9927
Robinlovelace
commented
2 months ago Looks like there's a work-around documented by Quarto developer here: https://github.com/quarto-dev/quarto-cli/issues/10146
Can you give that a try if you get a chance @michaeldorman or anyone? It's odd because I thought we had captions and subcaps but not sure...
michaeldorman
commented
2 months ago Looks like there's a work-around documented by Quarto developer here: quarto-dev/quarto-cli#10146
Can you give that a try if you get a chance @michaeldorman or anyone? It's odd because I thought we had captions and subcaps but not sure...
I don't really understand how to implement this fix and what's going on...
The "good" example from the thread you mentioned does work fine standalone:
#| label: fig-test
#| layout-ncol: 2
#| fig-subcap:
#|   - " "
#|   - " "
#| fig-cap: cap
import matplotlib.pyplot as plt
plt.plot([1,23,2,4])
plt.show()

plt.plot([8,65,23,90])
plt.show()
When embedded in our book, it becomes stretched but with digits also stretched only in the local preview:
Anyway, the other figures in our book do contain fig-subcap like you say, and still they are stretched, so I don't see how to implement the solution even if it is indeed a solution.
Also, using plt.subplots(figsize=(x,y)) does affect figure size but the figures still come out stretched, so it doesn't solve the issue either.
Robinlovelace
commented
2 months ago Many thanks for testing Michael, I've passed that info on in the upstream issue. I cannot think of any other work-arounds at this point and am hopeful of an upstream fix :pray:
michaeldorman
commented
2 months ago Thanks @Robinlovelace 👍
michaeldorman
commented
2 months ago Many thanks for testing Michael, I've passed that info on in the upstream issue. I cannot think of any other work-arounds at this point and am hopeful of an upstream fix 🙏
Maybe waiting for a quarto fix is a good idea. I just noticed that in the PDF version figures are not stretched, so I guess we can leave the HTML as-is for now
Some of the figures are stretched, for example: https://py.geocompx.org/03-spatial-operations#fig-raster-slope
Interestingly, they look fine in the local version: