Open raiphilibert opened 6 years ago
Thanks for the report! (was this working correctly in a previous version of geopandas? That is quite possible as we refactored a lot of the plotting code)
I am not fully sure why this is not working (might also be a matplotlib bug), as with the below snippet it seems we correctly pass the label to the collection (both lines and polygons are each plotted as one collection). Example with points and polygons (gives the same problem, points get legend handle, polygons not):
In [3]: polygons = geopandas.read_file(geopandas.datasets.get_path('naturalearth_lowres'))
In [4]: points = geopandas.read_file(geopandas.datasets.get_path('naturalearth_cities'))
In [6]: fig,ax=plt.subplots()
...: points.plot(ax=ax,color='k', linewidth=3,label='point')
...: polygons.plot(ax=ax,color='r',label='poly')
...: ax.get_legend_handles_labels()
...:
Out[6]: ([<matplotlib.collections.PathCollection at 0x7f07ebe97b00>], ['point'])
In [7]: ax.collections
Out[7]:
[<matplotlib.collections.PathCollection at 0x7f07ebe97b00>,
<matplotlib.collections.PatchCollection at 0x7f07ebe97940>]
In [8]: col_polygons = ax.collections[1]
In [9]: col_polygons.get_label()
Out[9]: 'poly'
OK, this is a 'limitation' of matplotlib. They only support automatically creating legend handlers for some collections, so for points and lines they do, but not for PatchCollections (polygons). So we could in principle, if a label is passed, create ourselves a legend handle, and pass that to matplotlib.
Hello
Yes, it was working in a previous version of geopandas (but I haven't been good at keeping track of the version numbers).
Thanks for the response. I'll try a workaround for now!
Just checking in to see if there's an update on this? It's a nice-to-have but not necessary.
No update I think, but contributions are very welcome!
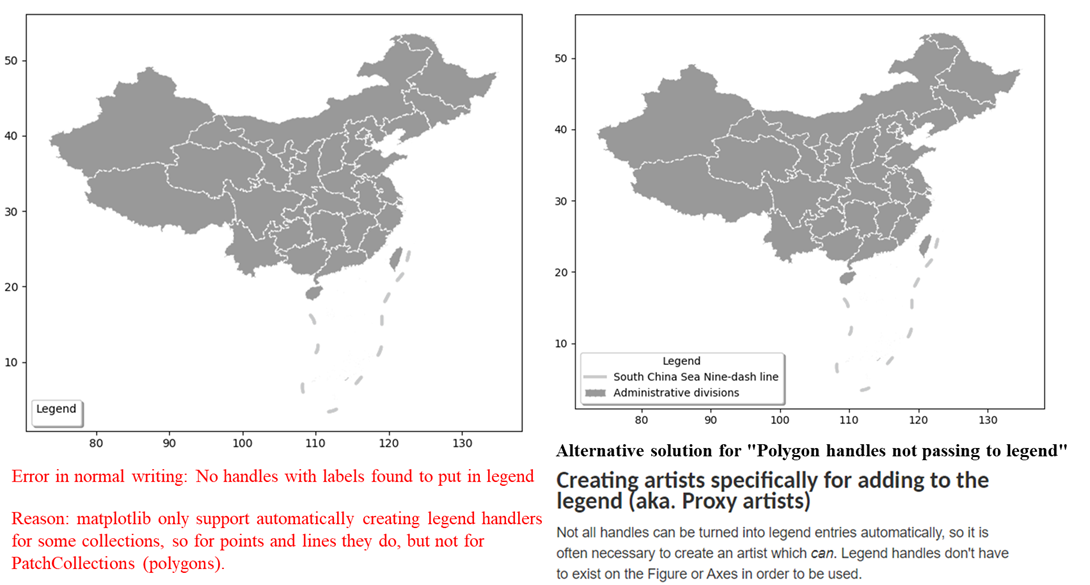
I'm using geopandas 0.8.1, and I also faced this problem. Here is my solution
# load China polygon
rgn = gpd.read_file(
'https://geo.datav.aliyun.com/areas_v2/bound/100000_full.json')
# Administrative divisions at provincial level in China (polygon)
china = rgn[rgn.level.isna() == False]
# South China Sea Nine-dash line (polygon)
nine_lines = rgn[rgn.level.isna()]
# Drawing features
fig, ax = plt.subplots(figsize=(8, 8))
ax = china.plot(ax=ax,
facecolor='grey',
edgecolor='white',
linestyle='--',
alpha=0.8,
label='Administrative divisions')
ax = nine_lines.plot(ax=ax,
edgecolor='grey',
linewidth=3,
alpha=0.4,
label='South China Sea Nine-dash line')
# Error in normal writing: No handles with labels found to put in legend.
# ax.legend(title='Legend', loc='lower left', ncol=1, shadow=True)
# Alternative solution for "Polygon handles not passing to legend"
import matplotlib.patches as mpatches
import matplotlib.pyplot as plt
pmark = mpatches.Patch(facecolor='grey',
edgecolor='white',
linestyle='--',
alpha=0.8,
label='Administrative divisions')
lmark = mlines.Line2D(
[],
[],
color='grey',
linewidth=3,
alpha=0.4,
label='South China Sea Nine-dash line')
handles, _ = ax.get_legend_handles_labels()
ax.legend(
handles=[
*handles,
lmark,
pmark],
title="Legend",
loc='lower left',
ncol=1,
shadow=True)
# show figure
plt.rcParams['legend.title_fontsize'] = 10
plt.show()
Although this approach can fulfill my requirements, it's really cumbersome, and I really hope that geopandas can fix it.
I am trying to plot some polygons and lines from geopandas dataframe and add a legend. However, when plotting the polygons, the labels don't get passed to the legend handles.
So for example
It returns: ([<matplotlib.collections.LineCollection at 0x116681d0>], ['line']) and does not include the polygon handles.
Anyone has an idea of how I could fix this? This seems to be a new issue for me.