 Emaasit
commented
5 years ago
Emaasit
commented
5 years ago @wraseman The best place to file this issue is at the respective package website: https://docs.r4photobiology.info/ggpmisc/. The author of the package is @aphalo Pedro J. Aphalo (pedro.aphalo@helsinki.fi).
Hello and thanks for your work on ggpmisc!
I ran into a small issue when trying to plot a linear regression equation forced through the origin.
I have a dataframe that looks like this...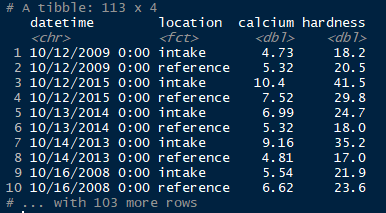
I'm trying to create a scatterplot of Total Hardness vs. Calcium Hardness and the linear regression equation on the plot with R^2. Using stat_poly_eq() I am very close but can't get the equation quite right.
The equation reads "yhat = 0.267" (see above) when it should read "yhat = 0.267x". It works when I don't force the equation through the origin but not when I do. Don't know if this is a bug or my lack of familiarity with the syntax.
Thanks!