gimli-org / gimli

Geophysical Inversion and Modeling Library :earth_africa:
https://www.pygimli.org
Other
344 stars 131 forks source link

Question: Odd VES1d inversion plot #671

Closed NoteboomM closed 2 months ago

NoteboomM commented 2 months ago

Problem description

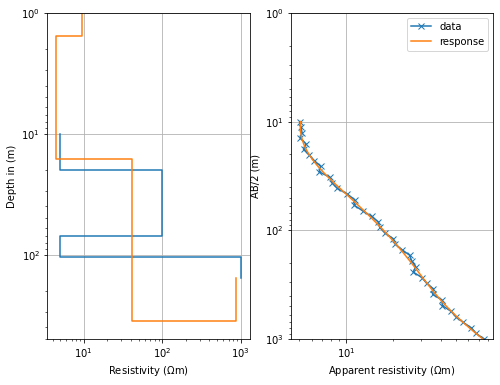
While trying some alternative setups and earth models with the "plot_2-dc1dblock.py" example, I created an example where, for lack of a better description, the inverted model wraps back on itself to shallower depth. Not sure if it's an issue, or just a combination of inputs that breaks the plotting, as the inverted model values (from list(ves.model)) looks sensible.

Your environment

  Date: Thu Mar 14 10:51:26 2024 W. Europe Standard Time

                OS : Windows
            CPU(s) : 20
           Machine : AMD64
      Architecture : 64bit
               RAM : 15.6 GiB
       Environment : IPython

  Python 3.9.18 | packaged by conda-forge | (main, Aug 30 2023, 03:40:31) [MSC
  v.1929 64 bit (AMD64)]

           pygimli : 1.5.0
            pgcore : 1.5.0
             numpy : 1.21.6
        matplotlib : 3.8.0
             scipy : 1.11.2
           IPython : 8.18.1
           pyvista : 0.43.4
--------------------------------------------------------------------------------

Steps to reproduce

# %%%
# We import numpy, matplotlib and the 1D plotting function
import numpy as np
import pygimli as pg
from pygimli.physics import VESManager

# %%%
# some definitions before (model, data and error)

ab2 = np.logspace(1., 3., 40)  # AB/2 distance (current electrodes)
###############################################################################

# %%%
# define a synthetic model and do a forward simulatin including noise
synres = [5., 100., 5., 1000.]  # synthetic resistivity
synthk = [20., 50., 35.]  # synthetic thickness (nlay-th layer is infinite)

###############################################################################
# the forward operator can be called by f.response(model) or simply f(model)
synthModel = synthk + synres  # concatenate thickness and resistivity
ves = VESManager()
rhoa, err = ves.simulate(synthModel, ab2=ab2, mn2=ab2/3,
                         noiseLevel=0.03, seed=1337)

# %%%
ves.invert(data=rhoa, error=err, ab2=ab2, mn2=ab2/3,
           nLayers=4,
           # startModel=[3]*3+[100]*4,
           lam=1000, lambdaFactor=0.8
           )

# %%%
# show estimated&synthetic models and data with model response in 2 subplots
fig, ax = pg.plt.subplots(ncols=2, figsize=(8, 6))  # two-column figure
ves.showModel(synthModel, ax=ax[0], label="synth", plot="semilogy", zmax=1.5*sum(synthk))
ves.showModel(ves.model, ax=ax[0], label="model", zmax=1.5*sum(synthk))
ves.showData(rhoa, ax=ax[1], label="data", color="C0", marker="x")
ves.showData(ves.inv.response, ax=ax[1], label="response", color="C1")

ax[0].set(ylim=(500,1)) # For model subplot; x is res, y is depth (xlim=(1,10000), )
ax[1].set(ylim=(1000,1))  # For data/response subplot, x is res, y is ab/2 (xlim=(1,1000), )

Expected behavior

Clearly the profile should continue to increasing depth to represent something more like 'reality'.

Actual behavior

Last layer in inverted model seems to plot upwards: Figure 2024-03-14 105011

NoteboomM commented 2 months ago

Ah...it's that zmax argument in ShowModel. I always think of it as a display limit, but that's not how it's used. (also...sorry about the open/closing mess!)

halbmy commented 2 months ago

No problem. That's actually a thing to be changed.