 Macxx-could
commented
1 year ago
Macxx-could
commented
1 year ago Based on the demo code on the official website, I gradually realized my own needs. I observed that the problem of popping up the repair box appeared after that step of operation, and then located the problem.
1. Run the demo code directly
⭐Result: The export is normal, the opening is normal, and the repair box does not pop up.
2. Replace demo data with backend data
Replace the chart data in the demo code with the chart data obtained from the backend.
⭐Result: The export is normal, the opening is normal, and the repair box does not pop up
This step ruled out the problem of the data format. I began to guess whether it was a problem with the configuration item, so I started to check the configuration item.
3. valAxes
Since my chart doesn't need to display the y-axis on both sides, I changed this configuration to the following:
// before
valAxes: [
    {
        showValAxisTitle: true,
        valAxisTitle: "Cars Produced (m)",
        valAxisMaxVal: 10,
        valAxisTitleColor: "1982c4",
        valAxisLabelColor: "1982c4",
    },
    {
        showValAxisTitle: true,
        valAxisTitle: "Global Market Share (%)",
        valAxisMaxVal: 10,
        valAxisTitleColor: "F38940",
        valAxisLabelColor: "F38940",
        valGridLine: { style: "none" },
    },
],
// after
const valAxesItem = {
    showValAxisTitle: false,
    valAxisHidden: true,
    valAxisLineShow: false,
    valGridLine: { style: 'none' }
}
valAxes: [valAxesItem, valAxesItem]
⭐Result: The export is normal, the opening is normal, and the repair box does not pop up
4. dataLabel
Because my chart needs to display the data label of each data point, I made the following configuration:
const comboProps = {
    chartArea: { fill: { color: "FFFFFF" } },
    barDir: "col",
    // barGrouping: "stacked", // delete this line
    // 👇
    showValue: true,
    showLabel: true,
    dataLabelPosition: 't',
    dataLabelFormatCode: '0.0"%"',
    dataLabelFontFace: "微软雅黑",
    dataLabelFontSize: 8,
    // 👆
    catAxisLabelColor: "494949",
    // ...more properties
}
⚠Result: The export is normal, and the pop-up repair box is opened.
Then I will add these lines of code and comment them line by line:
-
Comment out
dataLabelFontSize: still popup -
Continue to comment out
dataLabelFontFace: still pop-up window -
Continue to comment out
dataLabelFontFace: still pop-up window -
Continue to comment out
dataLabelFormatCode: still pop-up window -
⚠Continue to comment out
dataLabelPosition: the pop-up window disappears and opens normally -
⚠Comment out the
dataLabelPositionline separately, and uncomment other attributes: the export is normal, the opening is normal, no pop-up window
So I came to the source code file pptgenjs/dist/pptxgenjs.es.js to search for dataLabelPosition, and came to the 1815th line of code in the file, and checked the instructions in the REFERENCE URL left in the code
https://docs.microsoft.com/en-us/openspecs/office_standards/ms-oi29500/e2b1697c-7adc-463d-9081-3daef72f656f?redirectedfrom=MSDNlearned that
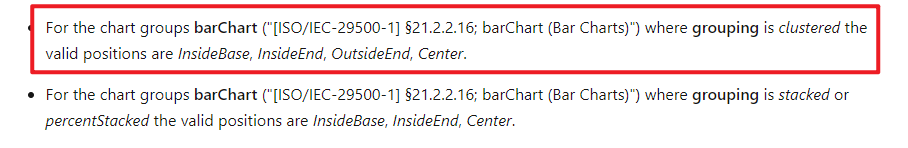
The legal value of dataLabelPosition of the histogram of barGrouping=clustered is one of InsideBase, InsideEnd, OutsideEnd, Center, the author of pptgenjs has processed this value, the code is as follows:
if (options.dataLabelPosition) {
    // ...
    if (options._type === CHART_TYPE.BUBBLE || options._type === CHART_TYPE.BUBBLE3D || options._type === CHART_TYPE.LINE || options._type === CHART_TYPE.SCATTER) {
        if (!['b', 'ctr', 'l', 'r', 't'].includes(options.dataLabelPosition))
            delete options.dataLabelPosition;
    }
    if (options._type === CHART_TYPE.BAR) {
        if (!['stacked', 'percentStacked'].includes(options.barGrouping || '')) {
            if (!['ctr', 'inBase', 'inEnd'].includes(options.dataLabelPosition))
                delete options.dataLabelPosition;
        }
        if (!['clustered'].includes(options.barGrouping || '')) {
            if (!['ctr', 'inBase', 'inEnd', 'outEnd'].includes(options.dataLabelPosition))
                delete options.dataLabelPosition;
        }
    }
}
It can be seen that the author hopes that when the value of dataLabelPosition is not the legal value of dataLabelPosition for a certain type of chart, clear dataLabelPosition and use the default value of dataLabelPosition.
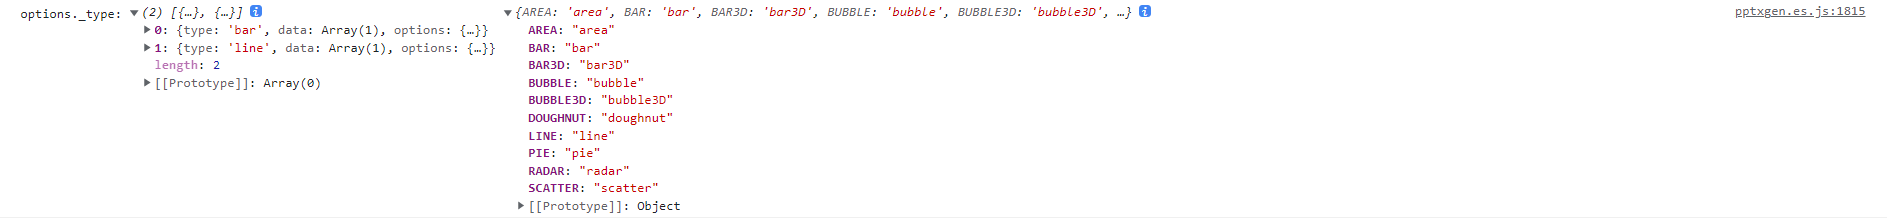
However, through console.log('options._type:', options._type, CHART_TYPE), I found that when we use a composite chart, the value of options._type is an array, and CHART_TYPE.XX The value of is a string, therefore, in the composite chart, the above piece of code cannot clear the illegal value of dataLabelPosition for certain types of charts.
For further verification, add console.log statements in these places of the code
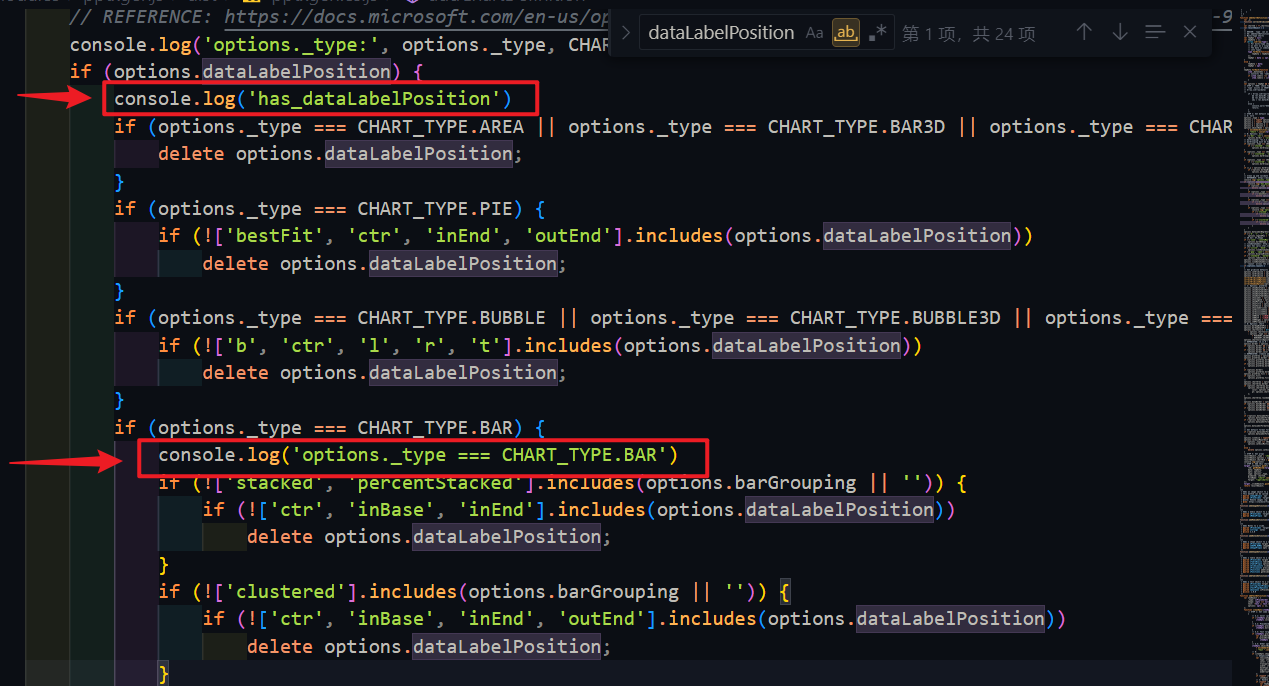
Then execute the operation of generating PPT, and the printed results displayed in the console are as follows
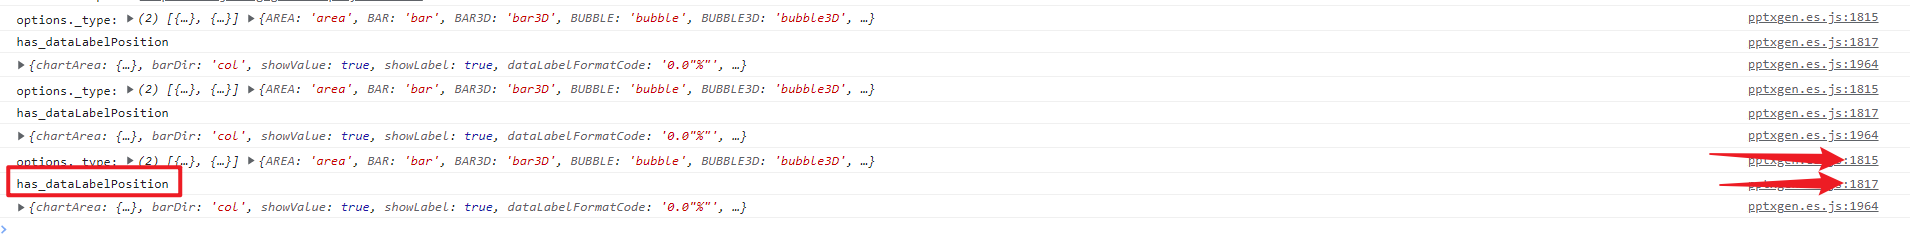
It can be seen that the logic of clearing the value of dataLabelPosition that is not legal is indeed not entered.
So I guess, is it because the value of dataLabelPosition of the histogram is illegal, which caused the repair window to pop up when opening the PPT file? After all, there is a problem with the content displayed in the pop-up window. Isn’t it a problem to use an illegal value?
At first I thought it was a bug, but then I ran to read the official documentation, thought about it carefully, and found that the documentation divides the properties of the chart into
- General attribute: General
- Histogram/line graph/data label attributes: Bar, DataLabel, Line
- etc
At first, I didn’t think there was any problem with writing the document like this. Now, combined with the above situation, I think the meaning of the document is to tell us that dataLabelPosition should not be placed in general, but should be placed in the separate options of the chart .
// comboTypes
{
    type: ppt.charts.BAR,
    data: [{
        name: config.barName,
        labels: config.labels,
        values: config.barValues,
    }],
    options: { chartColors: [config.barColor], barGapWidthPct: 250, dataLabelPosition: 'outEnd', },
},
Sure enough, I put it here, it exported normally, and no repair window popped up.
5. lineDataSymbolSize
This property will also cause the repair window to pop up, and strangely, the repair window will only pop up when the value of this property is 1.
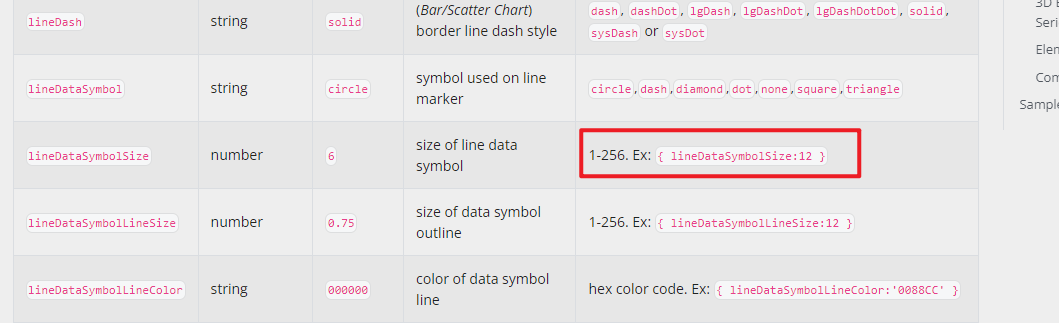
But in the documentation it shows that the value of this property can be 1-256
Even if I checked the source code, I didn't understand why, so I could only wait for the author's reply.
conclusion
The emergence of this problem is the result of the following points:
- The user did not use the library according to the official documentation
- The description in the official document is not well prepared. For example, the value of
dataLabelPositionhas different valid values that can be used in different charts, but there is no explanation in the document, but all the optional values of this attribute are placed. listed together. - There is a problem with the processing logic of the illegal value of
options.dataLabelPositionin the code.
Issue Category
Product Versions
Desired Behavior
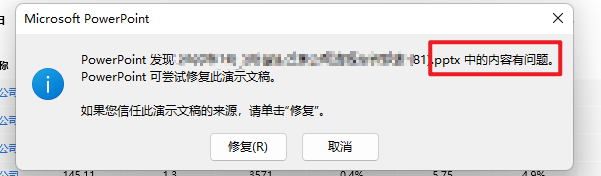
Observed Behavior
Pop-up repair when opening PPT
Click Repair, enter the PPT, the page with the chart becomes a blank page
If the code related to the chart is commented, this problem will not occur
Note that not all composite charts will have this problem, and composite charts on some pages can be displayed normally
Steps to Reproduce