So data would be 2d array now instead of 1d. This would totally break current API, so I guess it would be great feature for V3. This doesn't seem to hard to implement though.
Closed jesseward closed 5 years ago
So data would be 2d array now instead of 1d. This would totally break current API, so I guess it would be great feature for V3. This doesn't seem to hard to implement though.
I went ahead and worked up an implementation of multi-series line charts. You can see the code here:
https://github.com/uber-common/termui/tree/mjr-multi-series
It's obviously a breaking change with the existing API, but it's been very useful to me so far. Maybe we could make a new widget type of multiLineChart or something like that?
There are some issues with this when the lines intersect in a cell that I haven't addressed. I sort the series names so at least they are consistently obscured.
@gizak what do you think about this approach?
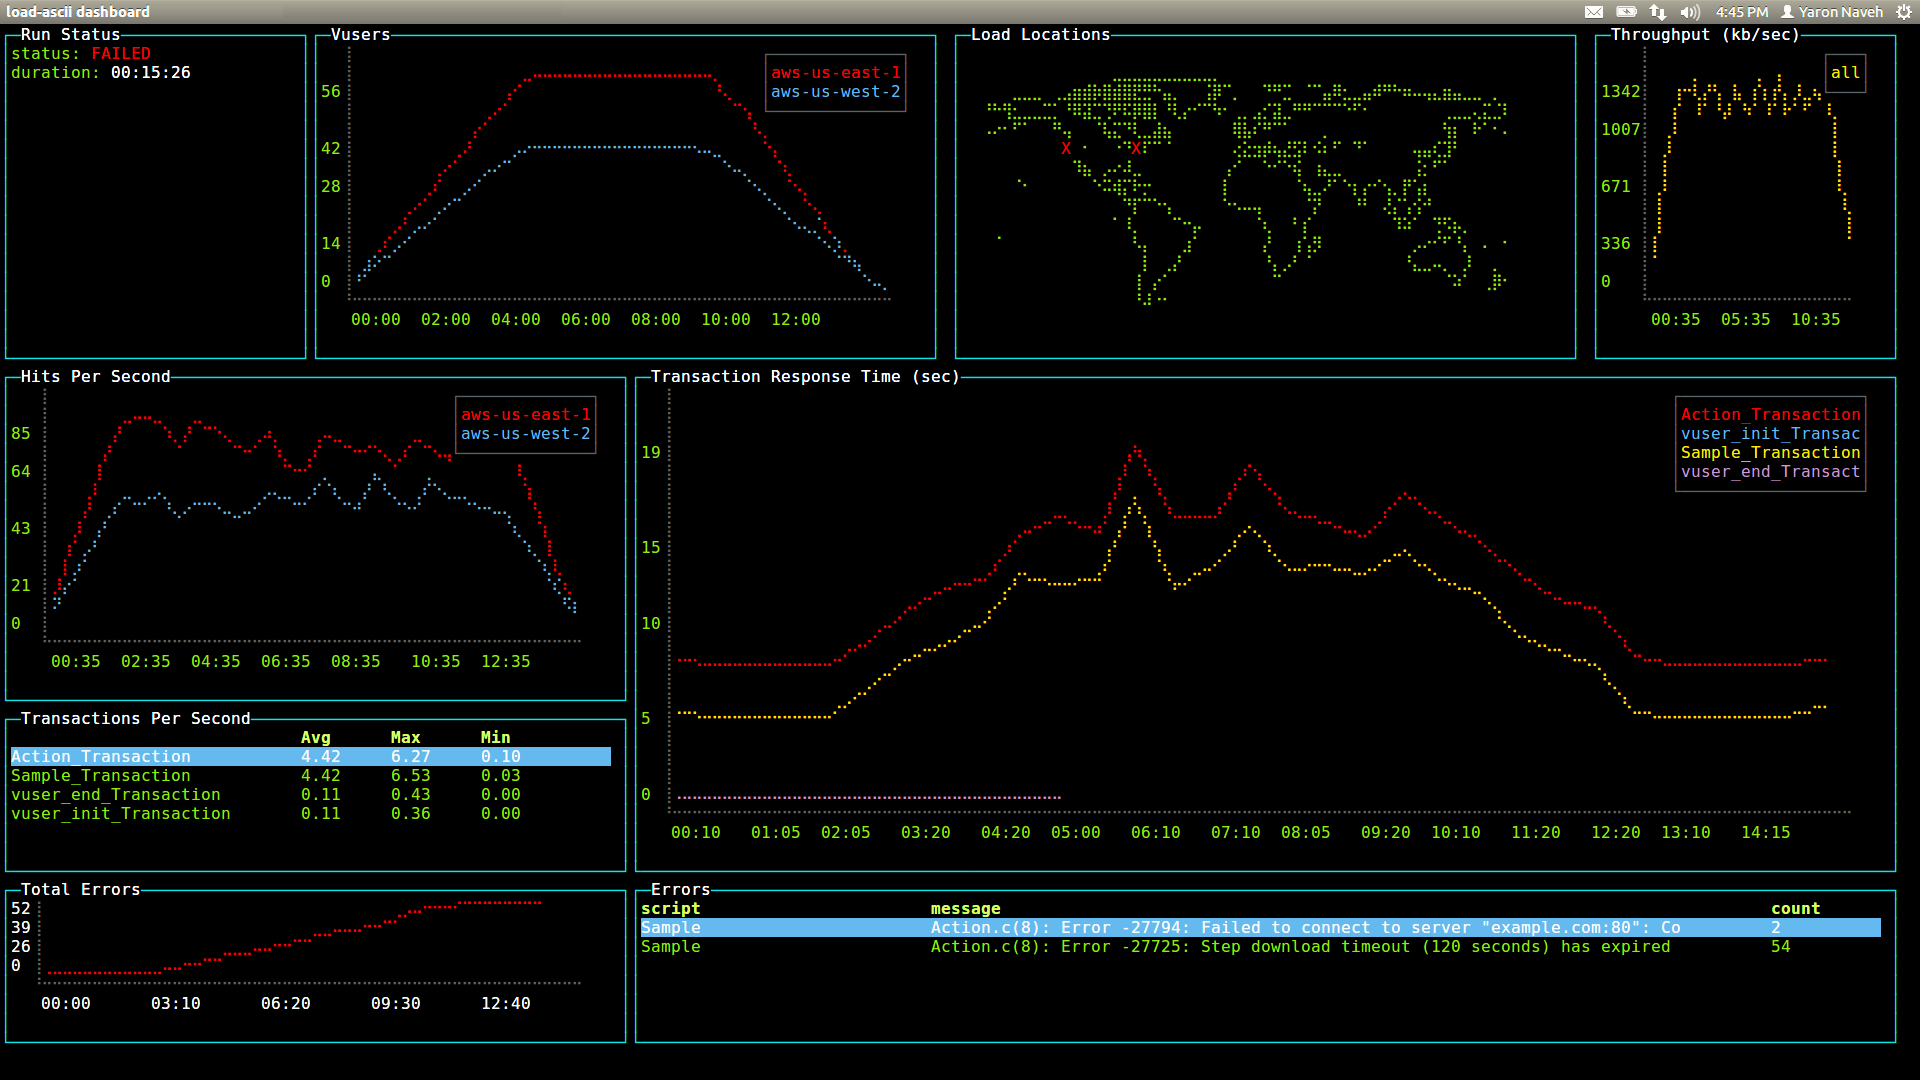
Here's a screenshot of the tool I've been working on that shows multiple graphs of multiple series. It's already being useful.

This has been added! Although I forget when :D
In the blessed-contrib nodejs package, the linechart is able to plot multiple datapoints on a single line graph .See Vusers, Hits Per Second and Transactions Response Time in the image below. Any possibility of adding this functionality to termui ? .
.