gliderlabs / logspout

Log routing for Docker container logs
MIT License
4.66k stars 681 forks source link

Logspout stops posting logs from some containers #377

Open janantala opened 6 years ago

janantala commented 6 years ago

Hello there,

I use logspout in docker cloud where I have multiple app containers in the single server. However logspout sometimes stops sending logs to cloudwatch for some of them. I see no error, they are just missing. Logspout container restart helps. This is my configuration:

logspout:
  autoredeploy: true
  command: 'cloudwatch://eu-west-1?DEBUG=1'
  deployment_strategy: every_node
  environment:
    - ALLOW_TTY=true
    - AWS_ACCESS_KEY_ID=*redacted*
    - AWS_SECRET_ACCESS_KEY=*redacted*
    - INACTIVITY_TIMEOUT=1m
    - LOGSPOUT=ignore
    - LOGSPOUT_GROUP=$DOCKERCLOUD_NODE_HOSTNAME
  image: 'mdsol/logspout:latest'
  restart: on-failure
  volumes:
    - '/var/run/docker.sock:/tmp/docker.sock'
tf42src commented 6 years ago

Same issue, similar config. I can see quite a few error messages like these:

2018/03/14 01:07:36 pump.pumpLogs(): d33949a9fd1d stopped with error: inactivity time exceeded timeout

for various containers. Is that actually an error or not? Does it mean it didn't receive logs within a certain timeframe oder something actually broke?

Running latest logspout including the #374 fix from our forked repo.

cat /src/VERSION
v3.3-dev
docker --version
Docker version 17.12.1-ce, build 7390fc6
tf42src commented 6 years ago

I tried switching to TCP as I could as well see some "message too long" errors. Now I am not getting any logs in my ELK stack anymore, but pump.Run() event: 19757wcrb4zq network:disconnect messages instead (from the logspout container using docker service logs <logspout service>). I can successfully connect to logstash using telnet <ELK IP> 5000.

Apparently 19757wcrb4zq is a container id. Why am I getting disconnect messages for container ids? Is logspout maintaining one tcp connection to logstash per container?

Please shed some light.

nehresma commented 6 years ago

I experience a similar issue with streaming to a remote syslog at papertrailapp. Restarting the logspout container fixes it. Came here looking to see if I'm the only one; apparently I'm not. :frowning_face:

shengsh commented 6 years ago

I had the same problem。Some containers log can't be send to logstash. Restarting the logstpout can fix it。But, after a few minutes, the problem has arisen again. There was no error message of logspout. Some information:

logspout version : v3.3-dev docker :version : 17.12.0-ce, build c97c6d6 log-dirver : json-file log-opts : max_size:1g

@michaelshobbs

richardARPANET commented 6 years ago

I've also ran into this issue multiple times. Before it was happening due to losing connection to papertrail. The logspout container logs did show that.

But now its happening and there is no interesting log output from the logspout container.

gbolo commented 6 years ago

can someone provide full log output from logspout container when this happens?

do you see the following message? pump.pumpLogs(): <container_id> dead

lionheart2016 commented 5 years ago

nothing more?

richardARPANET commented 5 years ago

@lionheart2016 setting the env var RETRY_COUNT to something like 30 helped for me (how many times to retry a broken socket (default 10))

forestjohnsonpeoplenet commented 5 years ago

I might be having the same problem. I believe it is related to this: but I am not sure.

https://github.com/gliderlabs/logspout/commit/977986a9e30db2fb37ba6401f1c1ab4082de40d5

  • Use InactivityTimeout to work around a bug in docker.

Log rotation causes 'docker logs --follow' to stop outputing logs (moby/moby#23913).

https://github.com/moby/moby/issues/23913

BUG REPORT: docker logs follow gets stuck when the json-file log driver rotates files #23913

forestjohnsonpeoplenet commented 5 years ago

I'm looking into this, what I found is this loop inside pump.go: https://github.com/gliderlabs/logspout/blob/e671009d9df10e8139f6a4bea8adc9c7878ff4e9/router/pump.go#L234

It looks to me like that loop is intended to spin around and around relatively slowly, basically, it is supposed to re-create this long-running streaming HTTP request to the docker API, whose response body contains the log stream from the desired container.

However, in my environment, that loop spins around many many times per second, consuming half of the CPU cycles on the host!! Therefore, as an experiment, I tried setting INACTIVITY_TIMEOUT=10s and changing

            sinceTime = time.Now()
            if err == docker.ErrInactivityTimeout {
                sinceTime = sinceTime.Add(-inactivityTimeout)
            }

to


            sinceTime = time.Now()
            if err == docker.ErrInactivityTimeout {
                sinceTime = sinceTime.Add(-inactivityTimeout)
            } else {
                time.Sleep(inactivityTimeout)
            }

This way at least this silly loop will not spin any faster than once every 10 seconds. Also, due to the way sinceTime is handled, it should not miss any logs either.

I've also started looking at collecting metrics from the log pumps and then configuring them to be automatically re-booted when they stop reporting log lines being pumped.

I have been testing it using this docker-compose:

version: '2'
services:
  logspout-test:
    image: logspout:test
    mem_reservation: 50428672
    environment:
      BACKLOG: 'false'
      DEBUG: '1'
      LOGSPOUT: ignore
      ROUTE_URIS: raw://output-tester:8080?filter.labels=forest.test.logger:*
      PUMP_REQUIRE_LABEL: forest.test.logger:*
    volumes:
    - /var/run/docker.sock:/var/run/docker.sock
    logging:
      driver: json-file
      options:
        max-file: '2'
        max-size: 10m
    command:
    - ./app
  logger:
    image: ubuntu
    entrypoint: /bin/bash
    command: ["-c", "while true; do cat /dev/urandom | tr -dc \"a-zA-Z0-9\" | fold -w 128 | head -n 100; sleep 0.1; done"]
    logging:
      driver: json-file
      options:
        max-file: '2'
        max-size: 1m
    labels:
      forest.test.logger: true
  output-tester:
    image: udp-byte-counter:1
    logging:
      driver: json-file
      options:
        max-file: '2'
        max-size: 10m

Due to that afformentioned bug in docker, with this setup, the stream of logs will cease when the log rotates:

9/10/2019 9:53:06 AM2019/09/10 14:53:06 bytes read: 0
9/10/2019 9:53:07 AM2019/09/10 14:53:07 bytes read: 0
9/10/2019 9:53:08 AM2019/09/10 14:53:08 bytes read: 0
9/10/2019 9:53:09 AM2019/09/10 14:53:09 bytes read: 0
9/10/2019 9:53:10 AM2019/09/10 14:53:10 bytes read: 0
9/10/2019 9:53:11 AM2019/09/10 14:53:11 bytes read: 0
9/10/2019 9:53:12 AM2019/09/10 14:53:12 bytes read: 0
9/10/2019 9:53:13 AM2019/09/10 14:53:13 bytes read: 75465
9/10/2019 9:53:14 AM2019/09/10 14:53:14 bytes read: 150285
9/10/2019 9:53:15 AM2019/09/10 14:53:15 bytes read: 217365
9/10/2019 9:53:16 AM2019/09/10 14:53:16 bytes read: 294765
9/10/2019 9:53:17 AM2019/09/10 14:53:17 bytes read: 359265
9/10/2019 9:53:18 AM2019/09/10 14:53:18 bytes read: 423249
9/10/2019 9:53:19 AM2019/09/10 14:53:19 bytes read: 423249
9/10/2019 9:53:20 AM2019/09/10 14:53:20 bytes read: 423249
9/10/2019 9:53:21 AM2019/09/10 14:53:21 bytes read: 423249
9/10/2019 9:53:22 AM2019/09/10 14:53:22 bytes read: 432284
9/10/2019 9:53:23 AM2019/09/10 14:53:23 bytes read: 436330
9/10/2019 9:53:24 AM2019/09/10 14:53:24 bytes read: 436330
9/10/2019 9:53:25 AM2019/09/10 14:53:25 bytes read: 436330
9/10/2019 9:53:26 AM2019/09/10 14:53:26 bytes read: 436330
9/10/2019 9:53:27 AM2019/09/10 14:53:27 bytes read: 436330
9/10/2019 9:53:28 AM2019/09/10 14:53:28 bytes read: 436330
9/10/2019 9:53:29 AM2019/09/10 14:53:29 bytes read: 436330
9/10/2019 9:53:30 AM2019/09/10 14:53:30 bytes read: 436330
9/10/2019 9:53:31 AM2019/09/10 14:53:31 bytes read: 436330
9/10/2019 9:53:32 AM2019/09/10 14:53:32 bytes read: 436330
9/10/2019 9:53:33 AM2019/09/10 14:53:33 bytes read: 436330
9/10/2019 9:53:34 AM2019/09/10 14:53:34 bytes read: 436330
9/10/2019 9:53:35 AM2019/09/10 14:53:35 bytes read: 436330
9/10/2019 9:53:36 AM2019/09/10 14:53:36 bytes read: 436330
9/10/2019 9:53:37 AM2019/09/10 14:53:37 bytes read: 436330
9/10/2019 9:53:38 AM2019/09/10 14:53:38 bytes read: 436330
9/10/2019 9:53:39 AM2019/09/10 14:53:39 bytes read: 436330

I am hoping to use this setup to test my metrics-based pump-restarter solution.

forestjohnsonpeoplenet commented 5 years ago

@gbolo

can someone provide full log output from logspout container when this happens?

It doesn't log anything. We see the log stream drop off in our log aggregation system (1 container at a time, not all at once) and there is zilcho in the logspout log around that time that it drops off. Even with DEBUG=1 logging on.

Now, this statement is true (for us) but it might be a bit misleading for everyone else. Let me explain, like I mentioned before, in our environment that loop inside pumpLogs() spins like crazy, so I did create another log level called trace for the following lines:

https://github.com/gliderlabs/logspout/blob/e671009d9df10e8139f6a4bea8adc9c7878ff4e9/router/pump.go#L235 https://github.com/gliderlabs/logspout/blob/e671009d9df10e8139f6a4bea8adc9c7878ff4e9/router/pump.go#L251 https://github.com/gliderlabs/logspout/blob/e671009d9df10e8139f6a4bea8adc9c7878ff4e9/router/pump.go#L249

also, line 245 was changed, I changed

            if err != nil {
                debug("pump.pumpLogs():", id, "stopped with error:", err)
            } else {
                debug("pump.pumpLogs():", id, "stopped")
            }

TO

            if err != nil {
                if err.Error() == "inactivity time exceeded timeout" {
                    traceLog("pump.pumpLogs():", normalName(container.Name), "stopped with error:", err)
                } else {
                    debugLog("pump.pumpLogs():", normalName(container.Name), "stopped with error:", err)
                }
            } else {
                traceLog("pump.pumpLogs():", normalName(container.Name), "stopped")
            }

So, besides those things which are called traceLog in my code, it does not log anything at all when it dies.

I was able to get my metrics-based "kick the tv to get the antenna to work" solution to at least "go off" in my test environment.

9/18/2019 6:38:25 PMtagValuesCSV: b6bc6e69659f,r-forest-test-logspout-logspout-test-logger-1-8e33059e, numberOfSamplesInARowThatHadZeroLogs: 0
9/18/2019 6:38:35 PMtagValuesCSV: b6bc6e69659f,r-forest-test-logspout-logspout-test-logger-1-8e33059e, numberOfSamplesInARowThatHadZeroLogs: 0
9/18/2019 6:38:45 PMtagValuesCSV: b6bc6e69659f,r-forest-test-logspout-logspout-test-logger-1-8e33059e, numberOfSamplesInARowThatHadZeroLogs: 1
9/18/2019 6:38:45 PM2019/09/18 23:38:45 tagValuesCSV: b6bc6e69659f,r-forest-test-logspout-logspout-test-logger-1-8e33059e, numberOfSamplesInARowThatHadZeroLogs: 1, distanceFromAverageToZeroInStandardDeviations: 1.59, logStreamIsDead: true
9/18/2019 6:38:45 PM2019/09/18 23:38:45 consumeDeadPumpAlerts() pumpId: b6bc6e69659f
9/18/2019 6:38:45 PM2019/09/18 23:38:45 pump.newContainerPump(): r-forest-test-logspout-logspout-test-logger-1-8e33059e stderr: EOF
9/18/2019 6:38:45 PM2019/09/18 23:38:45 pump.newContainerPump(): r-forest-test-logspout-logspout-test-logger-1-8e33059e stdout: EOF
9/18/2019 6:38:45 PM2019/09/18 23:38:45 pump.pumpLogs(): now tailing logs for: r-forest-test-logspout-logspout-test-logger-1-8e33059e

If it helps us solve our problem for real, I will see what I can do to contribute it back. However its quite a hack at this point :(

forestjohnsonpeoplenet commented 5 years ago

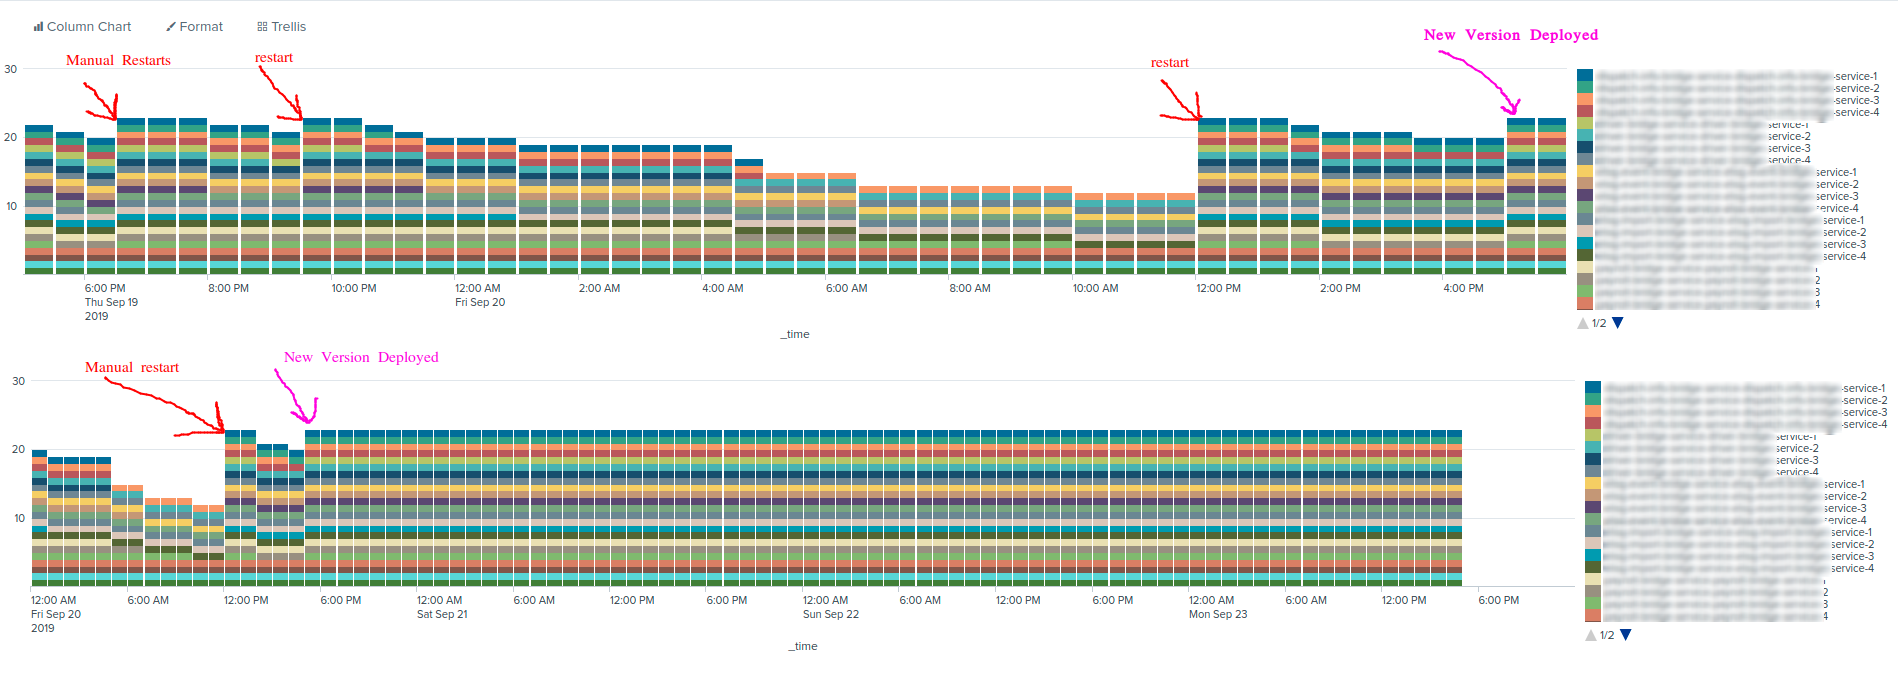
I was able to solve this by re-creating the pumps when metrics detect the log stream has halted un-expectedly.

This is a graph of time intervals and whether or not they contained at least 1 log message from each of our container instances. As you can see prior to my changes the logs from certain containers would drop off over time.

When I get time (when im not at work), I can push a slightly-cleaned-up version of my code to a fork for you guys.

(Edit: over longer intervals of time my metrics based alert and re-create system proved to be imperfect. Usually on containers which log infrequently. Its possible for the alert to get confused about the difference between a container that logs infrequently and a container that died. when this happens it does not restart the pump and things can still die permanently)

forestjohnsonpeoplenet commented 5 years ago

Please recognize that this is not meant to be a perfect contribution ready for merge. I am just sharing what I did in hopes that someone else can learn from it, take and run with it or use this as a stepping stone to discover a better solution.

Note that I did not test this at all beyond running make so its possible I jacked something up when I was patching this in.

https://github.com/forestjohnsonpeoplenet/logspout/commit/d927709f80fbef1ada6ce1f07d94ca674f646432

My code will attempt to send InfluxDB formatted metrics to a configurable endpoint as well (telegraf or influxdb). Remove this yourself if you wish. Otherwise you can leave it on in UDP mode and it will just scream into the void maybe??

Note that I also changed the default value for the inactivity timeout to 10s. And I added this sleep to prevent accidental DOS attacks against the docker API when the Docker API is being buggy: https://github.com/forestjohnsonpeoplenet/logspout/commit/d927709f80fbef1ada6ce1f07d94ca674f646432#diff-c035a4a8cbe5cb4d97ac075d044b8b84R303

Also, note that my code will adjust sinceTime, pushing it into the past sufficiently to ensure that no log messages will be skipped when the pump is restarted. As a side effect of this, some log messages may be duplicated when this happens. Keep that in mind if you chose to use this code. :man_shrugging:

Alternatively, you may be able to fix this issue by updating to the the latest verison of docker. I say that because I was not able to re-produce the issue on my local machine when using the latest version of Docker CE.

jackbenny commented 4 years ago

Have this been fixed yet (or have @forestjohnsonpeoplenet solution been implemented)?

I'm having the same issue, and not even @richardARPANET solution with RETRY_COUNT=30 seems to help for me. It usually occurs after 18-24 hours of silence. After that no more logs are being sent (tcp+syslog). The only workaround I've found so far is using udp+syslog instead. The problem have never occurred with udp+syslog as far as I know.

pongnguy commented 3 years ago

Does logspout send logs only from currently running containers? I am not seeing logs from container which execute and then terminate. Logs are sent if the same container is kept running (and without the -t option).