 thepudds
commented
6 years ago
thepudds
commented
6 years ago 16528 (now closed) I think might have been cited in discussion of a previous incarnation of this GC benchmark.
Also probably related is this prior blog post: https://making.pusher.com/golangs-real-time-gc-in-theory-and-practice/ (where that blog references #16528 as an unfixed cause of the behavior seen in that blog).
And also cited in that blog is this mailing list conversation from 2016: https://groups.google.com/d/msg/golang-nuts/nOD0fGmRp_g/b_FWITKtBQAJ
 dr2chase

 gopherbot
 LK4D4
LK4D4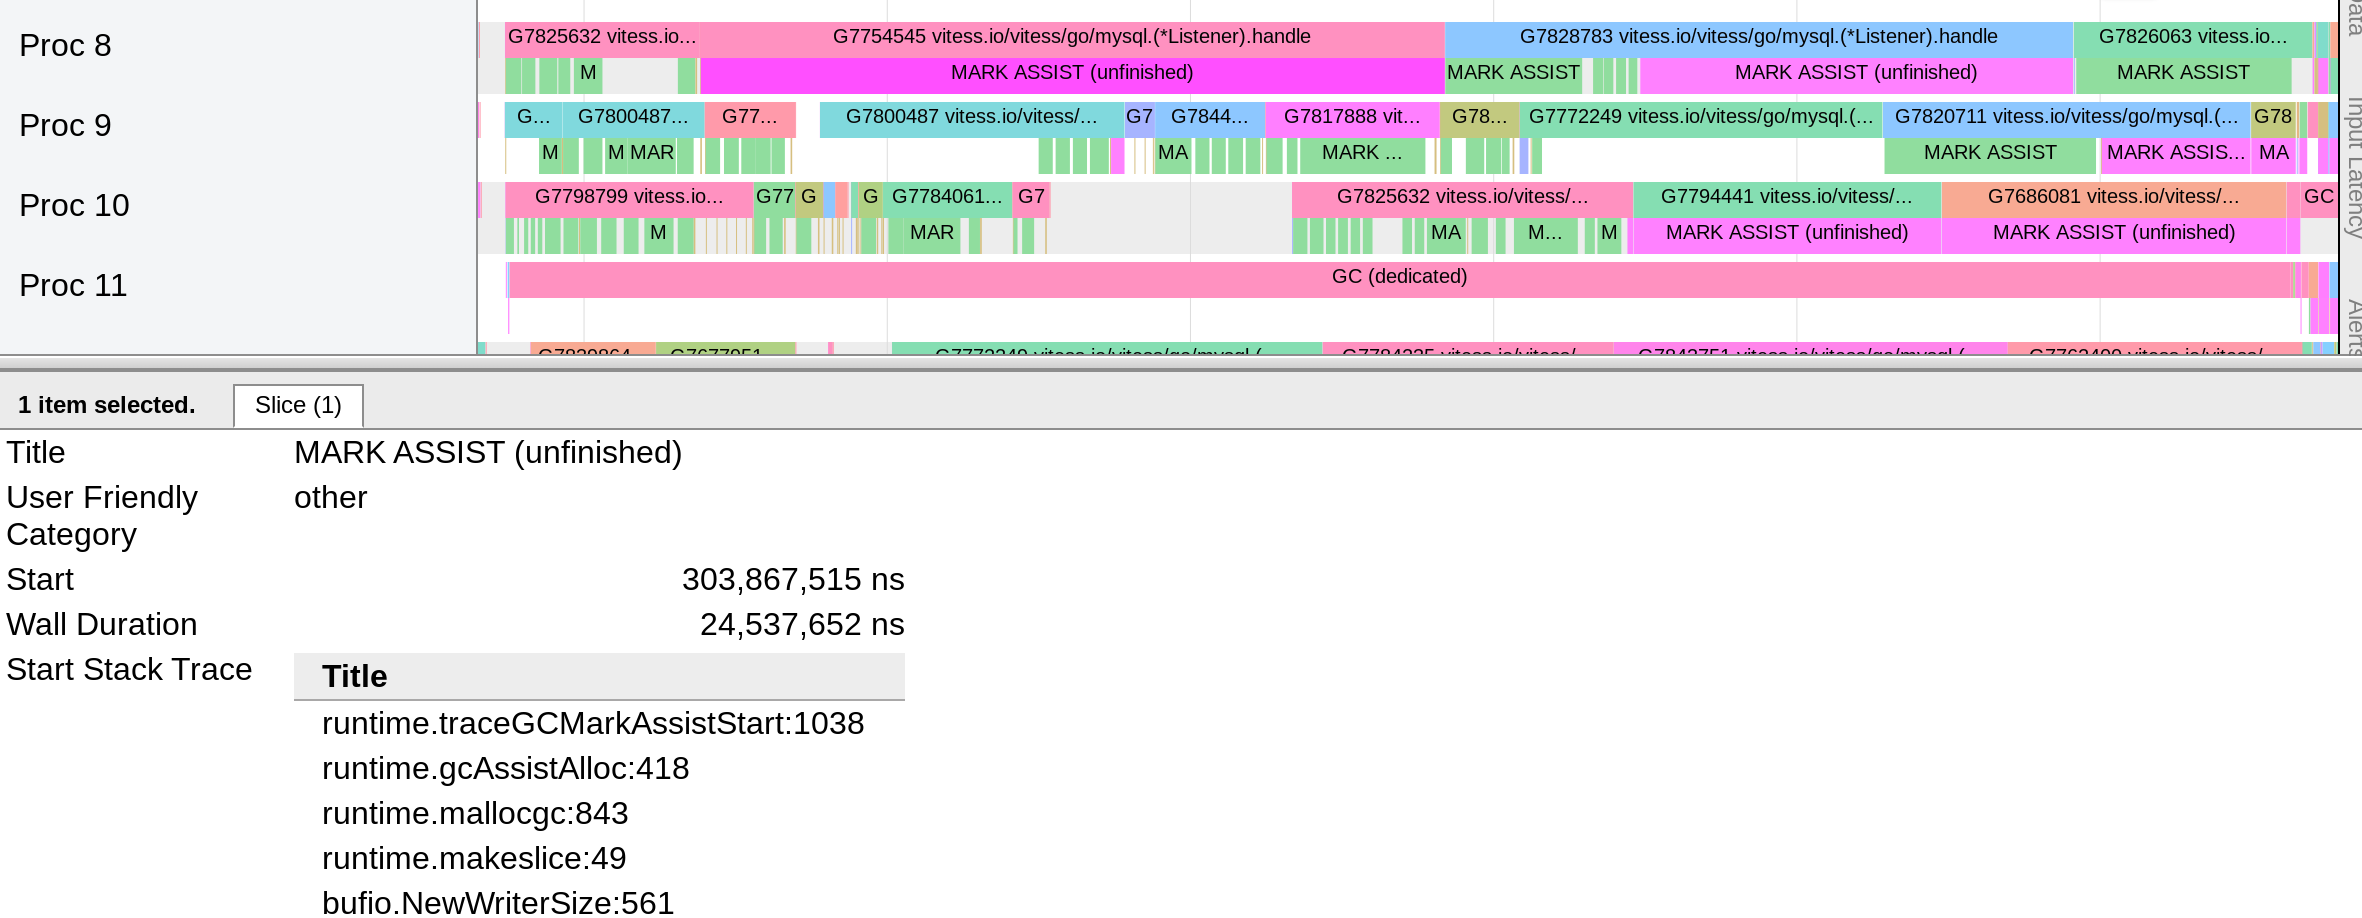 In go1.10 we had similar problem with SWEEP STW (
Please answer these questions before submitting your issue. Thanks!
What version of Go are you using (
go version)?1.11
Does this issue reproduce with the latest release?
Yes
What operating system and processor architecture are you using (
go env)?OSX (also observed on Linux), both AMD64.
What did you do?
This singlethreaded microbenchmark measures GC latency to allocate a byte slice and store it in a big circular buffer, repeating the operation 5 times the size of the big circular buffer (i.e. one initialization and four reuses). Live memory is about 210MB, in the form of the circular buffer (200,000 slice elements) and 200,000 pointer-free buffers of size 1k.
This version of the benchmark is instrumented to collect a trace, because that's how we figured out that it was mark assist.
The original benchmark source is https://github.com/WillSewell/gc-latency-experiment, adapted here to be more instrumented and more plain-spoken about what it is doing.
What did you expect to see?
I expected to see a sub-millisecond worst-case latency; the average time without GC to initialize a new slice is less about a microsecond (on a 2017 Mac laptop).
What did you see instead?
Worst-case latencies on the order of 4-10ms.
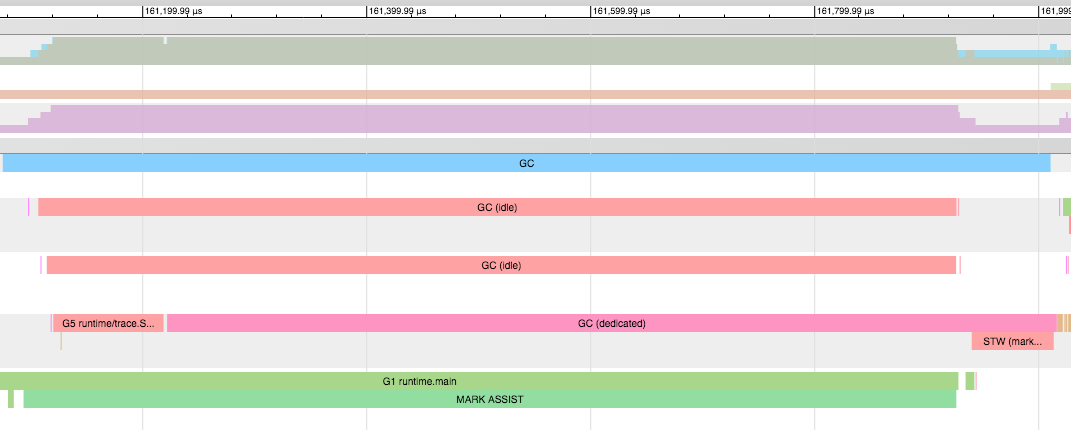
I'v attached the trace file for the following run:
The worst case latency ends at 995ms, corresponding to a single 5ms mark assist. A zoom of the trace displaying this is also attached.
trace2.out.gz