 savalin
commented
4 years ago
savalin
commented
4 years ago Sometimes HeapSys can cross the 20Gb line and continue to grow. But anyway, in the end, it crashes by OOM.
make run output:
docker run -i -t --rm --name="mem_leak_issue_example" mem_leak_issue_example
  => JSON parsed! 13695 edges found (data size: 1 Mb)
        ---
        Alloc = 4 MiB           TotalAlloc = 5 MiB              StackInuse = 0 MiB              StackSys = 0 MiB                Sys = 68 MiB
        HeapInuse = 4 MiB               HeapSys = 63 MiB                HeapIdle = 59 MiB               HeapReleased = 59 MiB           NumGC = 1
        ---
  => loading graph: 1 time
  => main dijkstra graph created!
  => all shortest created!
        ---
        Alloc = 4778 MiB                TotalAlloc = 4784 MiB           StackInuse = 0 MiB              StackSys = 0 MiB                Sys = 4999 MiB
        HeapInuse = 4780 MiB            HeapSys = 4799 MiB              HeapIdle = 19 MiB               HeapReleased = 19 MiB           NumGC = 5
        ---
  => time spent for #1 iteration: 46.386397248s

  => loading graph: 2 time
  => main dijkstra graph created!
  => all shortest created!
        ---
        Alloc = 7959 MiB                TotalAlloc = 9565 MiB           StackInuse = 0 MiB              StackSys = 0 MiB                Sys = 8327 MiB
        HeapInuse = 7961 MiB            HeapSys = 7999 MiB              HeapIdle = 38 MiB               HeapReleased = 38 MiB           NumGC = 6
        ---
  => time spent for #2 iteration: 1m7.918595613s

  => loading graph: 3 time
  => main dijkstra graph created!
  => all shortest created!
        ---
        Alloc = 7932 MiB                TotalAlloc = 14345 MiB          StackInuse = 0 MiB              StackSys = 0 MiB                Sys = 11587 MiB
        HeapInuse = 7935 MiB            HeapSys = 11135 MiB             HeapIdle = 3200 MiB             HeapReleased = 39 MiB           NumGC = 7
        ---
  => time spent for #3 iteration: 2m0.464184203s

  => loading graph: 4 time
  => main dijkstra graph created!
  => all shortest created!
        ---
        Alloc = 7401 MiB                TotalAlloc = 19124 MiB          StackInuse = 0 MiB              StackSys = 0 MiB                Sys = 13989 MiB
        HeapInuse = 7404 MiB            HeapSys = 13439 MiB             HeapIdle = 6035 MiB             HeapReleased = 1094 MiB         NumGC = 8
        ---
  => time spent for #4 iteration: 1m22.015146944s

  => loading graph: 5 time
  => main dijkstra graph created!
  => all shortest created!
        ---
        Alloc = 7125 MiB                TotalAlloc = 23903 MiB          StackInuse = 0 MiB              StackSys = 0 MiB                Sys = 13996 MiB
        HeapInuse = 7128 MiB            HeapSys = 13439 MiB             HeapIdle = 6311 MiB             HeapReleased = 1094 MiB         NumGC = 9
        ---
  => time spent for #5 iteration: 3m4.971564521s

  => loading graph: 6 time
  => main dijkstra graph created!
  => all shortest created!
        ---
        Alloc = 7832 MiB                TotalAlloc = 28682 MiB          StackInuse = 0 MiB              StackSys = 0 MiB                Sys = 13996 MiB
        HeapInuse = 7835 MiB            HeapSys = 13439 MiB             HeapIdle = 5603 MiB             HeapReleased = 1359 MiB         NumGC = 10
        ---
  => time spent for #6 iteration: 2m58.776212055s

  => loading graph: 7 time
  => main dijkstra graph created!
  => all shortest created!
        ---
        Alloc = 7958 MiB                TotalAlloc = 33462 MiB          StackInuse = 0 MiB              StackSys = 0 MiB                Sys = 16375 MiB
        HeapInuse = 7961 MiB            HeapSys = 15743 MiB             HeapIdle = 7781 MiB             HeapReleased = 4044 MiB         NumGC = 11
        ---
  => time spent for #7 iteration: 2m36.79324975s

  => loading graph: 8 time
  => main dijkstra graph created!
  => all shortest created!
        ---
        Alloc = 7943 MiB                TotalAlloc = 38242 MiB          StackInuse = 0 MiB              StackSys = 0 MiB                Sys = 16375 MiB
        HeapInuse = 7947 MiB            HeapSys = 15743 MiB             HeapIdle = 7796 MiB             HeapReleased = 4044 MiB         NumGC = 12
        ---
  => time spent for #8 iteration: 2m8.8423409s

  => loading graph: 9 time
  => main dijkstra graph created!
  => all shortest created!
        ---
        Alloc = 7737 MiB                TotalAlloc = 43022 MiB          StackInuse = 0 MiB              StackSys = 0 MiB                Sys = 16375 MiB
        HeapInuse = 7741 MiB            HeapSys = 15743 MiB             HeapIdle = 8001 MiB             HeapReleased = 4044 MiB         NumGC = 13
        ---
  => time spent for #9 iteration: 2m34.0415312s

  => loading graph: 10 time
  => main dijkstra graph created!
  => all shortest created!
        ---
        Alloc = 7573 MiB                TotalAlloc = 47802 MiB          StackInuse = 0 MiB              StackSys = 0 MiB                Sys = 16375 MiB
        HeapInuse = 7577 MiB            HeapSys = 15743 MiB             HeapIdle = 8166 MiB             HeapReleased = 4044 MiB         NumGC = 14
        ---
  => time spent for #10 iteration: 2m7.3474907s

  => loading graph: 11 time
  => main dijkstra graph created!
  => all shortest created!
        ---
        Alloc = 7136 MiB                TotalAlloc = 52583 MiB          StackInuse = 0 MiB              StackSys = 0 MiB                Sys = 16375 MiB
        HeapInuse = 7139 MiB            HeapSys = 15743 MiB             HeapIdle = 8604 MiB             HeapReleased = 4007 MiB         NumGC = 15
        ---
  => time spent for #11 iteration: 2m21.9883134s

  => loading graph: 12 time
  => main dijkstra graph created!
  => all shortest created!
        ---
        Alloc = 11915 MiB               TotalAlloc = 57362 MiB          StackInuse = 0 MiB              StackSys = 0 MiB                Sys = 16383 MiB
        HeapInuse = 11918 MiB           HeapSys = 15743 MiB             HeapIdle = 3825 MiB             HeapReleased = 3789 MiB         NumGC = 16
        ---
  => time spent for #12 iteration: 2m56.7413751s

  => loading graph: 13 time
  => main dijkstra graph created!
  => all shortest created!
        ---
        Alloc = 11295 MiB               TotalAlloc = 62141 MiB          StackInuse = 0 MiB              StackSys = 0 MiB                Sys = 16385 MiB
        HeapInuse = 11297 MiB           HeapSys = 15743 MiB             HeapIdle = 4445 MiB             HeapReleased = 3031 MiB         NumGC = 17
        ---
  => time spent for #13 iteration: 2m27.8519324s

  => loading graph: 14 time
  => main dijkstra graph created!
  => all shortest created!
        ---
        Alloc = 11170 MiB               TotalAlloc = 66922 MiB          StackInuse = 0 MiB              StackSys = 0 MiB                Sys = 17178 MiB
        HeapInuse = 11172 MiB           HeapSys = 16511 MiB             HeapIdle = 5339 MiB             HeapReleased = 4175 MiB         NumGC = 17
        ---
  => time spent for #14 iteration: 1m36.1320743s

  => loading graph: 15 time
  => main dijkstra graph created!
  => all shortest created!
        ---
        Alloc = 6608 MiB                TotalAlloc = 71701 MiB          StackInuse = 0 MiB              StackSys = 0 MiB                Sys = 19556 MiB
        HeapInuse = 6613 MiB            HeapSys = 18815 MiB             HeapIdle = 12202 MiB            HeapReleased = 6959 MiB         NumGC = 19
        ---
  => time spent for #15 iteration: 2m3.7917447s

  => loading graph: 16 time
  => main dijkstra graph created!
  => all shortest created!
        ---
        Alloc = 11387 MiB               TotalAlloc = 76481 MiB          StackInuse = 0 MiB              StackSys = 0 MiB                Sys = 19556 MiB
        HeapInuse = 11391 MiB           HeapSys = 18815 MiB             HeapIdle = 7424 MiB             HeapReleased = 5797 MiB         NumGC = 19
        ---
  => time spent for #16 iteration: 1m18.4857651s

  => loading graph: 17 time
  => main dijkstra graph created!
  => all shortest created!
        ---
        Alloc = 7956 MiB                TotalAlloc = 81259 MiB          StackInuse = 0 MiB              StackSys = 0 MiB                Sys = 21934 MiB
        HeapInuse = 7963 MiB            HeapSys = 21119 MiB             HeapIdle = 13156 MiB            HeapReleased = 6899 MiB         NumGC = 20
        ---
  => time spent for #17 iteration: 2m8.3264648s

  => loading graph: 18 time
  => main dijkstra graph created!
  => all shortest created!
        ---
        Alloc = 7952 MiB                TotalAlloc = 86039 MiB          StackInuse = 0 MiB              StackSys = 0 MiB                Sys = 21934 MiB
        HeapInuse = 7958 MiB            HeapSys = 21119 MiB             HeapIdle = 13161 MiB            HeapReleased = 7299 MiB         NumGC = 21
        ---
  => time spent for #18 iteration: 1m42.3431658s

  => loading graph: 19 time
  => main dijkstra graph created!
  => all shortest created!
        ---
        Alloc = 7770 MiB                TotalAlloc = 90818 MiB          StackInuse = 0 MiB              StackSys = 0 MiB                Sys = 21934 MiB
        HeapInuse = 7773 MiB            HeapSys = 21119 MiB             HeapIdle = 13346 MiB            HeapReleased = 7864 MiB         NumGC = 22
        ---
  => time spent for #19 iteration: 2m24.4805832s

  => loading graph: 20 time
  => main dijkstra graph created!
  => all shortest created!
        ---
        Alloc = 7214 MiB                TotalAlloc = 95598 MiB          StackInuse = 0 MiB              StackSys = 0 MiB                Sys = 24314 MiB
        HeapInuse = 7218 MiB            HeapSys = 23423 MiB             HeapIdle = 16205 MiB            HeapReleased = 10737 MiB                NumGC = 23
        ---
  => time spent for #20 iteration: 2m52.8564558s

  => loading graph: 21 time
  => main dijkstra graph created!
make: *** [run] Error 137
In other words, the problem reproduction requires more time sometimes
 dmitshur
 randall77
 mknyszek
 lysu
lysu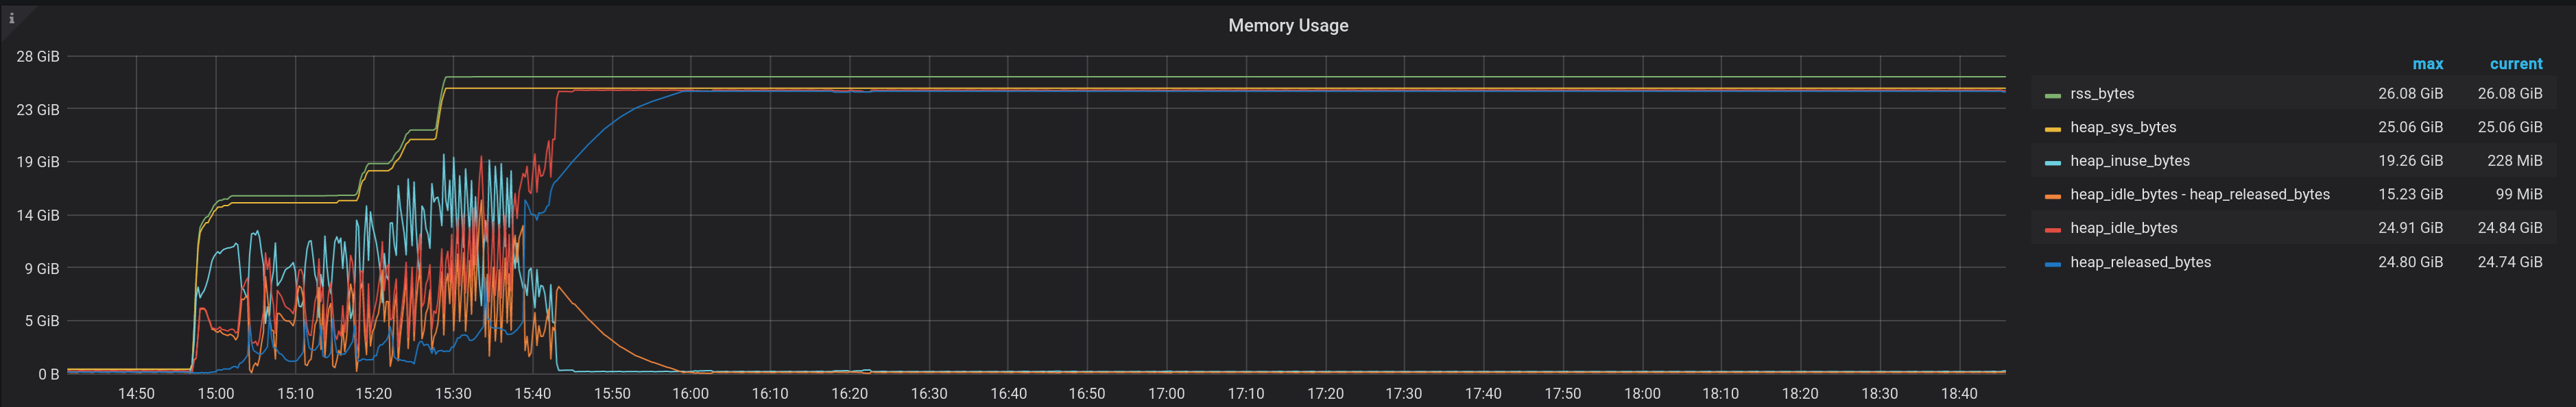
What version of Go are you using (
go version)?What operating system and processor architecture are you using?
Host machine - mac, Catalina 10.15.1, core i7, 2.5Ggz, 16Gb RAM In docker (19.03.5) - ubuntu:latest, 10Gb mem limit, swap off
I build the app for Linux architecture using flags GOOS/GOARCH
What did you do?
I've prepared an extended example based on #35848, but this one has one important difference: we have 'current' pointer to data and also we have an 'old' pointer that is removed (old=nil) right after new data generation. https://github.com/savalin/example/tree/extendend_dockerized_oom_example branch: _extendend_dockerized_oomexample (master is for #35858)
It demonstrates the problem we faced on production servers (kubernetes). In this example, we use one dataset and load it in a loop. OOM killer terminates it after ~10 iteration.
make build && make runOutputgo version go1.13.4 darwin/amd64 CGOENABLED=0 GOOS=linux GOARCH=amd64 go build ./main.go docker build --memory 10Gb --memory-swap 0 -t mem_leak_issue_example . Sending build context to Docker daemon 53.38MB Step 1/4 : FROM ubuntu:latest ---> 775349758637 Step 2/4 : COPY ./main . ---> f2df7c102986 Step 3/4 : COPY ./edges.json . ---> d21215b8d8de Step 4/4 : CMD ["/main"] ---> Running in a1765ec8a72c Removing intermediate container a1765ec8a72c ---> 550ae674af6d Successfully built 550ae674af6d Successfully tagged mem_leak_issue_example:latest $ make run docker run -i -t --rm --name="mem_leak_issue_example" mem_leak_issue_example => JSON parsed! 13695 edges found (data size: 1 Mb) --- Alloc = 4 MiB TotalAlloc = 5 MiB StackInuse = 0 MiB StackSys = 0 MiB Sys = 68 MiB HeapInuse = 4 MiB HeapSys = 63 MiB HeapIdle = 59 MiB HeapReleased = 59 MiB NumGC = 1 --- => loading graph: 1 time => main dijkstra graph created! => all shortest created! --- Alloc = 4778 MiB TotalAlloc = 4784 MiB StackInuse = 0 MiB StackSys = 0 MiB Sys = 4999 MiB HeapInuse = 4780 MiB HeapSys = 4799 MiB HeapIdle = 19 MiB HeapReleased = 19 MiB NumGC = 5 --- => time spent for #1 iteration: 43.563816952s => loading graph: 2 time => main dijkstra graph created! => all shortest created! --- Alloc = 7958 MiB TotalAlloc = 9564 MiB StackInuse = 0 MiB StackSys = 0 MiB Sys = 8327 MiB HeapInuse = 7960 MiB HeapSys = 7999 MiB HeapIdle = 39 MiB HeapReleased = 39 MiB NumGC = 6 --- => time spent for #2 iteration: 50.665379005s => loading graph: 3 time => main dijkstra graph created! => all shortest created! --- Alloc = 7198 MiB TotalAlloc = 14344 MiB StackInuse = 0 MiB StackSys = 0 MiB Sys = 12463 MiB HeapInuse = 7200 MiB HeapSys = 11967 MiB HeapIdle = 4766 MiB HeapReleased = 58 MiB NumGC = 7 --- => time spent for #3 iteration: 1m13.81873211s => loading graph: 4 time => main dijkstra graph created! => all shortest created! --- Alloc = 11978 MiB TotalAlloc = 19124 MiB StackInuse = 0 MiB StackSys = 0 MiB Sys = 14859 MiB HeapInuse = 11981 MiB HeapSys = 14271 MiB HeapIdle = 2290 MiB HeapReleased = 927 MiB NumGC = 8 --- => time spent for #4 iteration: 1m52.920715546s => loading graph: 5 time => main dijkstra graph created! => all shortest created! --- Alloc = 11236 MiB TotalAlloc = 23903 MiB StackInuse = 0 MiB StackSys = 0 MiB Sys = 15664 MiB HeapInuse = 11238 MiB HeapSys = 15039 MiB HeapIdle = 3800 MiB HeapReleased = 1672 MiB NumGC = 8 --- => time spent for #5 iteration: 1m34.722615361s => loading graph: 6 time => main dijkstra graph created! => all shortest created! --- Alloc = 7957 MiB TotalAlloc = 28683 MiB StackInuse = 0 MiB StackSys = 0 MiB Sys = 18043 MiB HeapInuse = 7962 MiB HeapSys = 17343 MiB HeapIdle = 9381 MiB HeapReleased = 3340 MiB NumGC = 9 --- => time spent for #6 iteration: 1m25.087806114s => loading graph: 7 time => main dijkstra graph created! => all shortest created! --- Alloc = 7480 MiB TotalAlloc = 33462 MiB StackInuse = 0 MiB StackSys = 0 MiB Sys = 18043 MiB HeapInuse = 7484 MiB HeapSys = 17343 MiB HeapIdle = 9859 MiB HeapReleased = 3635 MiB NumGC = 10 --- => time spent for #7 iteration: 1m15.462949042s => loading graph: 8 time => main dijkstra graph created! => all shortest created! --- Alloc = 12259 MiB TotalAlloc = 38242 MiB StackInuse = 0 MiB StackSys = 0 MiB Sys = 20424 MiB HeapInuse = 12263 MiB HeapSys = 19647 MiB HeapIdle = 7384 MiB HeapReleased = 5758 MiB NumGC = 11 --- => time spent for #8 iteration: 2m7.055378632s => loading graph: 9 time => main dijkstra graph created! => all shortest created! --- Alloc = 11368 MiB TotalAlloc = 43022 MiB StackInuse = 0 MiB StackSys = 0 MiB Sys = 20426 MiB HeapInuse = 11371 MiB HeapSys = 19647 MiB HeapIdle = 8276 MiB HeapReleased = 5914 MiB NumGC = 11 --- => time spent for #9 iteration: 1m33.04776087s => loading graph: 10 time => main dijkstra graph created! make: *** [run] Error 137What did you expect to see?
I expect the app consuming a constant amount of memory instead of increasing its consumption iteration by iteration.
What did you see instead?
When HeapSys reaches ~20Gb container terminates by OOM killer. Sometimes it requires more time to reproduce the issue, but on my laptop, it fails approximately at 10th iteration (see output above).