Open rhysh opened 3 years ago
Thanks for the really detailed report! I think your analysis of the situation makes a lot of sense. Maybe we can do something more clever about flushing mcaches. Honestly, forEachP
seems somewhat overkill in this situation. One simple idea I have is a much more simple loop that just preempts each P directly without holding sched.lock
.
~Another (and I like this one better) is to do the idle Ps here and then tell each P to do it when it next calls back into the scheduler (actively allocating Ps will already flush parts of it themselves). There's a chance we miss a P (e.g. a P transitions from active to idle and stays that way when we set the mark) because it'll be racy, but we can double-check in sweep termination. Missing a P should be unlikely.~ EDIT: This is already (almost) what forEachP
does, minus the races. :)
This must happen before the next GC cycle; we can delay the whole process until sweep termination but then that just pushes the problem somewhere else.
CC @prattmic
Change https://golang.org/cl/315171 mentions this issue: runtime: share sched.lock during forEachP
I think you're right that this is best addressed with a change to how the runtime prepares for sweep. A secondary effect of this is that a user goroutine can end up on the hook for several milliseconds of work (when GOMAXPROCS is large), if they happen to be doing an assist at the end of mark.
But because it's not quite May 1st (and with it the Go 1.17 freeze) in my time zone, I sent a proposal (CL 315171 above) to change forEachP to release and re-acquire the lock between every call to the provided function. It looks like runtime.unlock
will do a handoff if there's an M waiting on the lock, so the world should be able to restart quickly while forEachP chugs along.
It occurs to me that what I laid out earlier is basically what forEachP
already does, except it's racy because it avoids acquiring sched.lock
altogether. Given that forEachP
is only used in two places (though, notably, one of those places is mark termination and we need to be pretty careful there) just modifying forEachP
sounds like it could be the right way forward for mitigating this specific issue. I do still worry about the mark termination algorithm, though.
One idea that came up in brainstorming with @mknyszek is that we could potentially have findrunnable
call prepareForSweep
on idle Ps if it can't find any other work to do (really this just means calling acquirep
on each of them).
This has the advantage of allowing all of the runnable Gs to get going first after STW and only afterwards start worrying about the idle Ps. In general, I don't think we'd move cost to the start of the next GC, because we should handle all the idle Ps as long as we run out of work on one M at something point. And if we never run out of work, there shouldn't be any idle Ps at all.
The biggest downside to this is more complexity in the scheduler, where we've been trying to reduce complexity. There's also an argument that having the GC flush all of the idle Ps could reduce latency to start a P, but in practice I don't think that makes much difference (and is obviously the opposite case in this bug).
I have a reproducer. It's in the form of a benchmark for ease of setup, though it's not exactly a benchmark. The code is at the bottom, and I've included a few screenshots of execution traces that it generates. (The benchmark tries to calculate some measures of how often the application code is able to run, but the main value is in looking at the execution traces.)
This issue is a combination of a few circumstances:
Data from perf record -g -a -e 'sched:sched_switch' -e 'sched:sched_wakeup'
combined with execution traces that show fast vs slow resumption after stop-the-worlds point to the "spinning M" mechanism being in play when the application is slow to resume.
The execution traces below (from the reproducer at the very bottom) show the difference in speed between procresize+startTheWorldWithSema resuming lots of Ps (fast) and relying instead on the mspinning mechanism to get back to work (slow). These traces are from a server with two Intel sockets and a total of 96 hyperthreads. I've zoomed them all so the major time divisions are at 5ms intervals.
Here's go1.16.3 with a fast resume during the start of mark. When there are a lot of active Ps right before the STW, the program is able to have a lot of active Ps very soon after the STW. This is good behavior -- the runtime is able to deliver.
Here's another part of the go1.16.3 execution trace, showing a slow resume at the end of mark. Nearly all of the Gs are in the mark assist queue (the left half of the "Goroutines" ribbon is light green), and nearly all of the Ps are idle (very thin lavender "Threads" ribbon). Once the idle Ps start getting back to work (growing lavender, start of colored ribbons in the "Proc 0" etc rows), it takes about 4ms for the program to get back to work completely. This is the high-level bug behavior.
Here's a third part of the go1.16.3 execution trace, with an interesting middle-ground. After the STW, the lavender "Threads" ribbon grows to about 80% of its full height and stays there for a few hundred microseconds before growing, more slowly than before, to 100%. I interpret this as almost all of the Ps having had local work (so procresize returns them and they're able to start immediately), then forEachP holding sched.lock for a while and preventing further growth, and finally the mspinning mechanism finding the remaining Ps and putting them to work.
Here's Go tip at the parent of PS 6, go version devel go1.17-8e91458b19 Fri Apr 30 20:00:36 2021 +0000
. It shows similar behavior to the first go1.16.3 image. This is from a different phase in the benchmark's lifecycle, so the "Goroutines" ribbon looks a little different. The idle Ps take about 5ms to get to work.
Here's PS 6, which (1) assigns goroutines from the global run queue to idle Ps as part of starting the world and (2) does not hold sched.lock in the parts of forEachP that do substantial work. It's from the same part of the benchmark's lifecycle as the previous image, but it only takes about 300µs for the Ps to get to work.
package test
import (
"encoding/hex"
"flag"
"math/rand"
"os"
"runtime"
"sort"
"sync"
"sync/atomic"
"testing"
"time"
)
var (
sink atomic.Value
ballast *link
busyLen = flag.Int("busy-bytes", 1000000, "busy loop size")
bucketDuration = flag.Duration("bucket-duration", 100*time.Microsecond, "size of time buckets")
workerAlloc = flag.Int("worker-alloc", 30000, "target for memory allocation between sleeps")
ballastSize = flag.Int("ballast", 30000000, "Number of bytes to retain")
)
const (
ballastPointerCount = 100
ballastByteCount = 1000
)
type link struct {
a [ballastPointerCount]*link
b [ballastByteCount]byte
}
func TestMain(m *testing.M) {
flag.Parse()
for i := 0; i < (*ballastSize)/(8*ballastPointerCount+ballastByteCount); i++ {
var next link
for i := range next.a {
next.a[i] = ballast
}
ballast = &next
}
os.Exit(m.Run())
}
// BenchmarkResume attempts to demonstrate issue 45894. It generates some
// measurements, but its main result is execution traces that show an
// application that is slow to resume work after the GC's mark phase ends.
//
// It does its work by launching many goroutines that allocate memory in several
// sizes: so each P will have work to do in mcache.prepareForSweep, and for many
// chances for goroutines to get blocked on mark assist credit.
//
// It records the time when each goroutine was able to make progress. That might
// end up as a concise measure of how well the program is able to make progress
// while the GC runs, but for now the clearest signal comes from looking at
// execution traces (via the "-test.trace" flag and "go tool trace" command).
func BenchmarkResume(b *testing.B) {
whenCh := make(chan time.Time, b.N)
when := make([]time.Time, 0, b.N)
var wg sync.WaitGroup
wg.Add(1)
go func() {
defer wg.Done()
for w := range whenCh {
when = append(when, w)
}
}()
var mem runtime.MemStats
runtime.ReadMemStats(&mem)
busy := make([]byte, *busyLen)
var seed int64
b.SetParallelism(10)
b.ResetTimer()
b.RunParallel(func(pb *testing.PB) {
rng := rand.New(rand.NewSource(atomic.AddInt64(&seed, 1)))
busyDest := make([]byte, hex.EncodedLen(len(busy)))
for pb.Next() {
runtime.Gosched()
hex.Encode(busyDest, busy[:rng.Intn(len(busy))])
todo := *workerAlloc
var v []byte
for _, class := range mem.BySize {
if todo < int(class.Size) {
break
}
todo -= int(class.Size)
v = make([]byte, int(class.Size))
}
sink.Store(v)
v = make([]byte, todo)
whenCh <- time.Now()
}
})
b.StopTimer()
close(whenCh)
wg.Wait()
// Trim off first and last quarter of the time range, to catch the test in
// steady state.
sort.Slice(when, func(i, j int) bool { return when[i].Before(when[j]) })
when = when[len(when)/4 : 3*len(when)/4]
if len(when) < 2 {
return
}
start := when[0]
end := when[len(when)-1]
buckets := make([]int, 1+int(end.Sub(start)/(*bucketDuration)))
for _, t := range when {
delta := t.Sub(start)
bucket := int(delta.Truncate((*bucketDuration)) / (*bucketDuration))
buckets[bucket]++
}
// Trim off the last bucket, which may not cover the full interval.
buckets = buckets[:len(buckets)-1]
if len(buckets) < 1 {
return
}
sort.Sort(sort.IntSlice(buckets))
first := len(buckets)
for i, n := range buckets {
if n > 0 {
first = i
break
}
}
// See note at top about how useful these measurements are for describing
// the issue.
b.ReportMetric(100*float64(first)/float64(len(buckets)), "empty-percent")
b.ReportMetric(float64(len(buckets)), "buckets")
b.ReportMetric(float64(buckets[len(buckets)/2]), "count-p50")
b.ReportMetric(float64(buckets[len(buckets)/10]), "count-p90")
b.ReportMetric(float64(buckets[len(buckets)/20]), "count-p95")
}
This effect still appears after an upgrade to Go 1.18. I've included an example execution trace below.
Looking back at the reproducer I shared on 2021-05-05, I see it demonstrates some of the behaviors I've seen in production, but it's missing a key component: time where a single goroutine is in runtime.gcMarkDone
's call to runtime.gcMarkTermination
and no other goroutines are running. In the affected production services that's usually around 5ms, but the reproducer never shows that as over a millisecond. (Out of 100 runs on a 96-thread machine, the reproducer's p100 for that is 908µs and its p95 is 111µs.)
The go tool trace
UI draws the end of the "GC" ribbon when it gets the GCDone
event in runtime.gcMarkTermination
: https://github.com/golang/go/blob/go1.18/src/runtime/mgc.go#L965
The go tool trace
UI draws the end of the "STW" region when it gets the GCSTWDone
event in runtime.startTheWorldWithSema
as called by runtime.gcMarkTermination
a bit later: https://github.com/golang/go/blob/go1.18/src/runtime/mgc.go#L1037
The call to runtime.gcMarkTermination
comes at the end of runtime.gcMarkDone
, and when the end of the mark phase is triggered by an assist, that's called by runtime.gcAssistAlloc
: https://github.com/golang/go/blob/go1.18/src/runtime/mgcmark.go#L477
The go tool trace
UI draws the end of the "MARK ASSIST" region when it gets the GCMarkAssistDone
event in runtime.gcAssistAlloc
: https://github.com/golang/go/blob/go1.18/src/runtime/mgcmark.go#L510
And when a P starts running, the execution tracer draws a "proc start" line immediately after runtime.acquirep
calls runtime.(*mcache).prepareForSweep
: https://github.com/golang/go/blob/go1.18/src/runtime/proc.go#L4873
So Proc 42 in this execution trace is doing something within runtime.gcMarkTermination
for about 8ms, all while the rest of the threads are unable to start.
I collected CPU profiles from several hours of running time (on 48-thread machines) of one of the affected apps with Go 1.18. I've cut it down to time in runtime.gcMarkTermination
, and to time in runtime.(*mcache).prepareForSweep
. I'm not sure exactly what to make of the profiles. The first shows a lot of time in runtime.mProf_FlushLocked
, but I don't have an explanation for how work there would delay any other Ps from announcing ProcStart
events in the execution trace. In the second, the number of samples in runtime.futex
within the runtime.acquirep
tree make me think that there's significant contention on the global runtime.mheap_
lock, and to wonder if that explains most of the delay.
Even if the runtime is able to get all of the Ms and Ps running quickly, they'll need serialize again for the mheap lock before they can do any work.
$ go tool pprof -proto -focus=gcMarkTermination -show_from=gcMarkTermination
$ go tool pprof -proto -focus=prepareForSweep -show_from='(forEachP|acquirep)'
$ go tool pprof -png -nodefraction=0 -edgefraction=0 -nodecount=1000
Wow, that STW section is tiny compared to the rest of it. I do wonder where that time is going. I really wish we could instrument the runtime and really break down into which of mProf_Flush
, prepareFreeWorkbufs
, freeStackSpans
, and prepareForSweep
. Absent that, I think your CPU profiles gives a lot of interesting insights. For one, mProf_Flush
takes kind of a long time. It would be nice to do that more asynchronously. It just needs to happen, I think, before the next GC ends? In which case, just giving it to some system goroutine and making sure it runs before the next cycle seems way better for latency.
It is definitely weird that there aren't any Ps starting up in your execution trace. I'm not really sure how to explain it either. Starting the world calls wakep
which should in theory start a sort of chain reaction. Maybe whatever awoke thought there was nothing to do? This seems like a scheduler issue to me more than anything else. Like you, I have no idea how any of the post-start-the-world tasks would actually prevent user goroutines from starting up again.
The contention you're observing on mheap_.lock
is also interesting. It looks like it's mainly coming from the freeSpan
path of freeing completely empty spans back to the page allocator. Back when I revamped the page allocator I left more scalable freeing as future work because no clear solution jumped out at me. One key observation is that freeing benefits greatly from batching together frees of nearby addresses. (The most expensive part is summarize
and you basically need to do that once per free, no matter how much is freed in a particular 4 MiB chunk of address space.) There's a lot of potential here, but I'm not really sure how to make that kind of batching happen, since the spans we're freeing could be anywhere.
Bottlenecks in restarting the world aside, it occurs to me that having an assist be responsible for the post-start-the-world tasks results in a pretty gnarly latency hit to whatever that goroutine was doing specifically. If other things are blocked on that goroutine, that's not great application-wide.
mProf_Flush
holds proflock
while it works. That lock is also necessary for mProf_Free
, called from freeSpecial
, called from sweepLocked.sweep
.
The app depicted in the Go 1.18 execution trace uses the default setting for MemProfileRate of 512 kiB, the default GOGC=100, and a 10 GiB []byte ballast. It serves a large variety of requests that are typically much faster than the time between GCs. It does lots of small allocations at lots of unique allocation sites, around 10k locations and 100k stacks after a couple hours of run time. Each GC finds about 11 GB of garbage (live heap is about 1 GiB, plus 10 GiB ballast), so probably including 20,000 allocations known to the heap profiler. I don't know these parts (handling of specials, sweeping, mheap) well ... might every P in the app be trying to free a profiled allocation, and so be waiting on their M to have a turn on proflock? A delay getting that lock in acquirep
's call to prepareForSweep
would mean a delay in writing out a ProcStart
trace event.
Doing the mProf_Flush
work in a system goroutine, if it's still in one big chunk of work, would mean other weird delays in the app: every 512 kiB of allocation, every time there's a new event for the block profiler (which this app happens to use), etc. And being a runtime lock, it ties up a P (and an M) for every waiter and it's hard to see with the execution tracer.
Though in general, handing off the end-of-mark bookkeeping to a system goroutine would be nice!
Yes, a big mProf can cause this behavior. (No need for dozens of threads!) Based on the CPU profiles I shared of the app on Go 1.18, that accounts for about 2/3rds of the post-STW CPU time in gcMarkTermination, so would pay dividends if fixed.
The start of mprof.go is a note of "Everything here could use cas if contention became an issue." I plan to try fixing that in the next couple weeks. Is that a patch the runtime owners would be interested in for Go 1.19, @mknyszek ?
Here's an execution trace from the 2021-05-05 reproducer, after adding code to allocate memory at at a few hundred thousand different call stacks, run with -memprofilerate=1
. It shows a 4.6ms gap from the end of the STW region on Proc 1 to when the other threads are able to get back to work.
func init() {
const depth = 18
dive0(depth, func() {
sink.Store(make([]byte, runtime.MemProfileRate))
})
}
func dive0(depth int, fn func()) {
if depth > 0 {
dive0(depth-1, fn)
dive1(depth-1, fn)
} else {
fn()
}
}
func dive1(depth int, fn func()) {
if depth > 0 {
dive0(depth-1, fn)
dive1(depth-1, fn)
} else {
fn()
}
}
Change https://go.dev/cl/399956 mentions this issue: runtime: split mprof locks
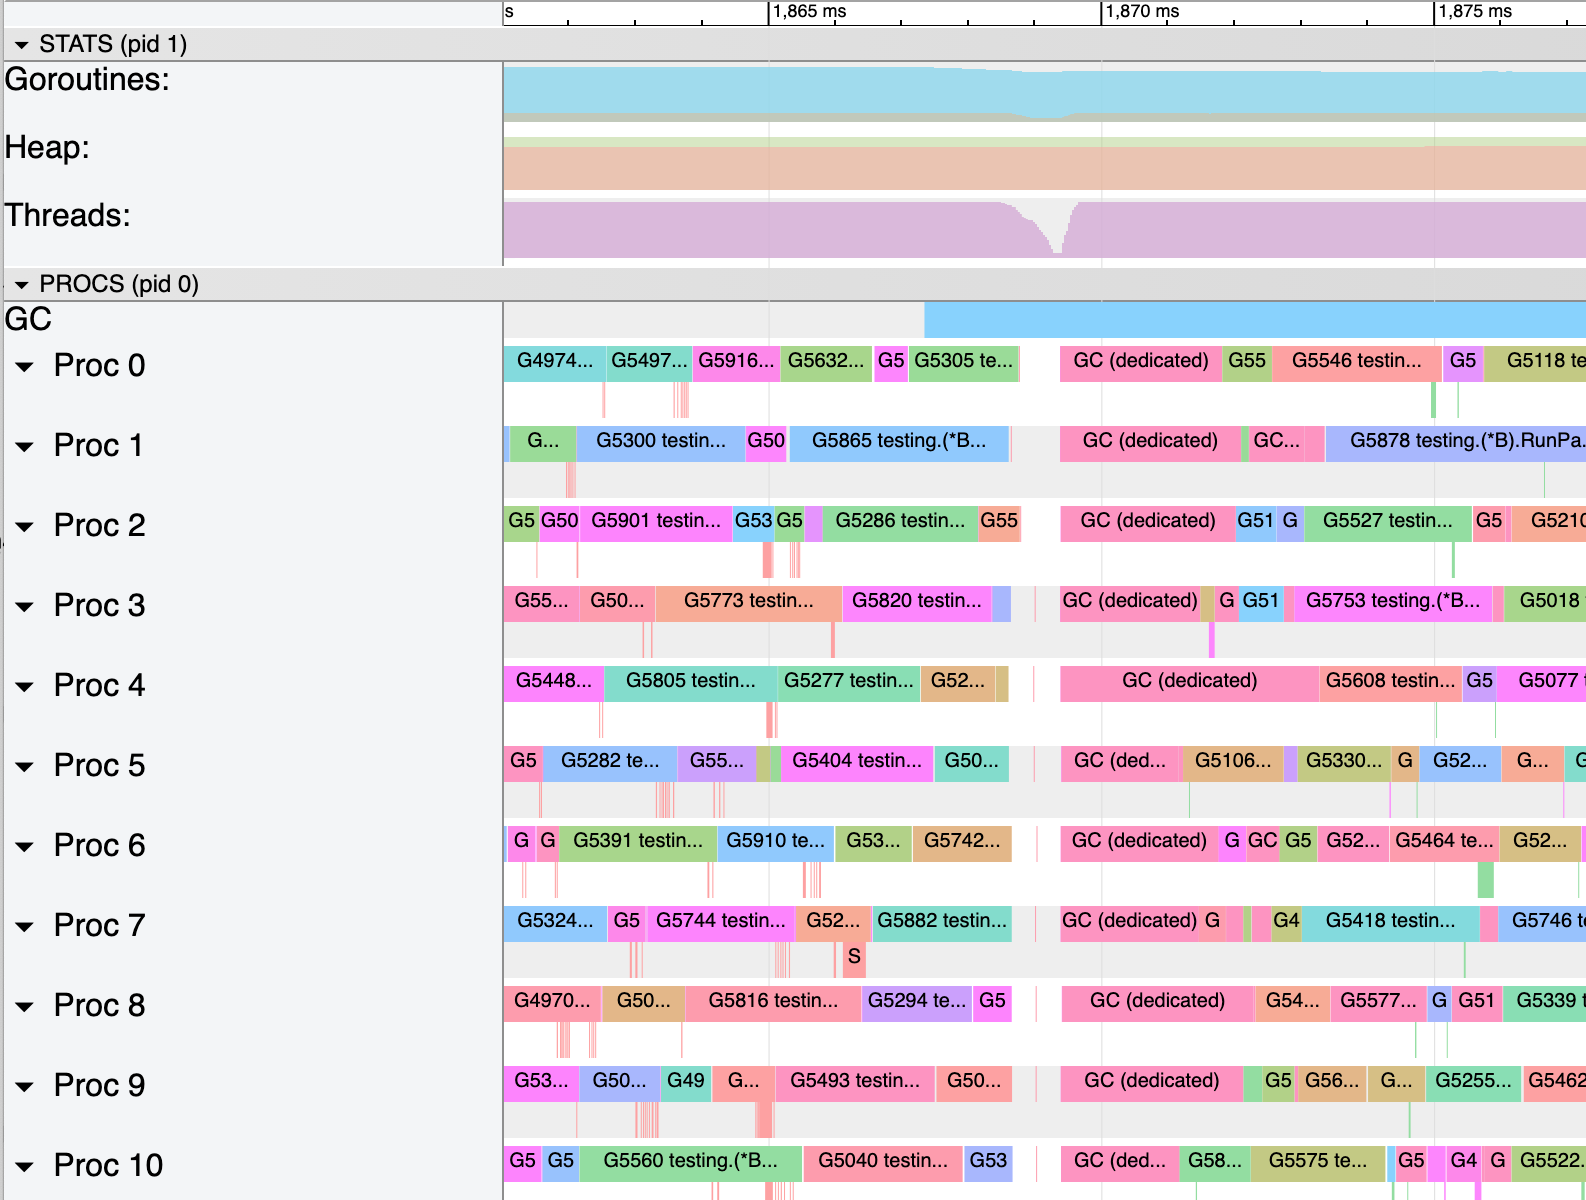
What version of Go are you using (
go version
)?Most of the data I have is from
go1.15.6
.Does this issue reproduce with the latest release?
Yes, I have seen the same effect (as viewed from execution traces) in an app that uses
go1.16.3
.What operating system and processor architecture are you using (
go env
)?GOOS=linux and GOARCH=amd64
What did you do?
I have an app that uses
go1.15.6
on machines with 96 hyperthreads (GOMAXPROCS=96), and an app that usesgo1.16.3
on machines with 36 hyperthreads (GOMAXPROCS=36).What did you expect to see?
I expected the app's goroutines to resume work immediately after the runtime declares end of the mark termination stop-the-world phase. I expected processors to resume work one at a time, staggered by at most a few tens of microseconds, with dozens of threads resuming useful work every millisecond.
What did you see instead?
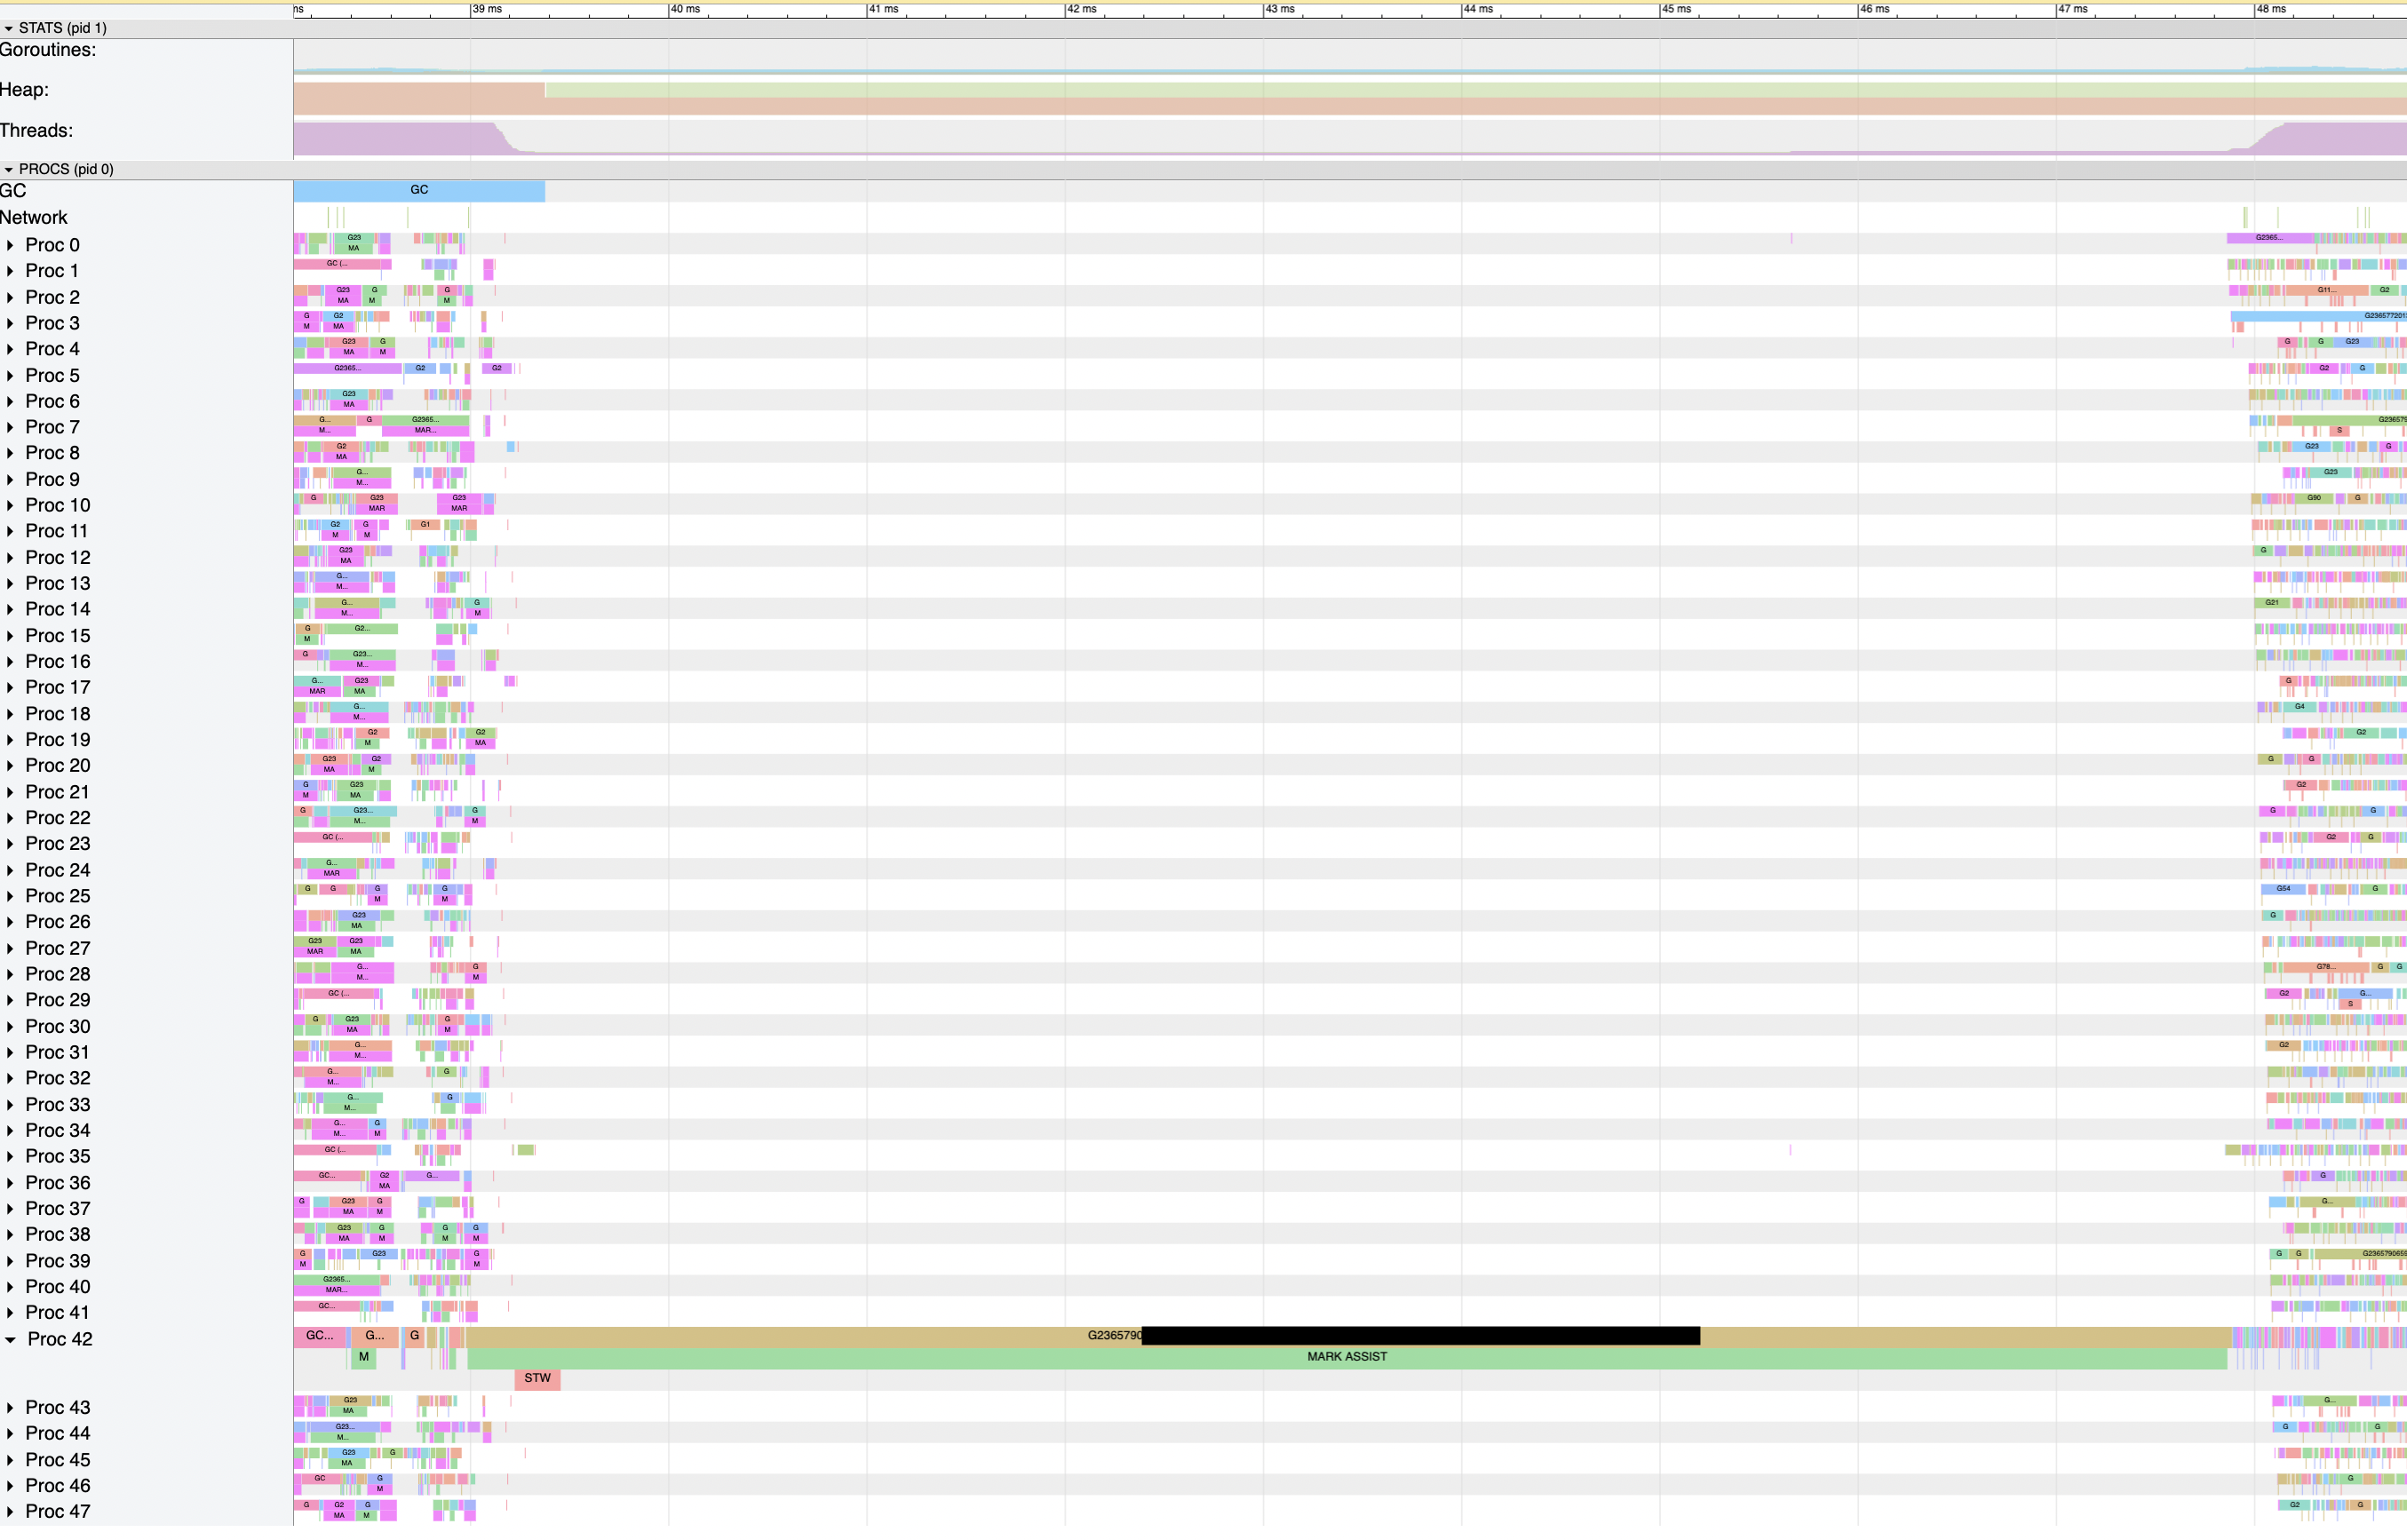
I see in execution traces that these applications are slow to resume useful work at the end of the garbage collector's mark phase. The application using Go 1.15 and 96-hyperthread machines has a particularly low latency goal (tail of a few milliseconds), and the slow resumption of work introduces about 5 to 10ms of extra idle time during each GC run.
My read of the traces, of profiles from
perf
, and the runtime source is that althoughruntime.gcMarkDone
prepares goroutines to run (in large part by injecting the Gs that were blocked on assist credit into the global run queue) andruntime.gcMarkTermination
restarts the world (so Ps can pick up and execute Gs), thegcMarkTermination
function follows that up immediately by usingruntime.forEachP
to callruntime.mcache.prepareForSweep
.When the goroutine that's finishing up the mark phase calls
runtime.forEachP
, it has only recently allowed the world to restart, so most Ps are still idle. That function obtainsruntime.sched.lock
and holds onto it while iterating the list of idle Ps, and calling the provided function for each one. My understanding ofsched.lock
is that it guards access to the global goroutine run queue (among other things) -- and that in the two applications where I've seen this effect, nearly every goroutine in the program that would be runnable is sitting in the global run queue since nearly all of them became blocked on assist credit during the mark phase.I've included some screenshots from
go tool trace
and contiguous section of the output ofgo tool trace -d
below the fold, all from a single execution trace of the Go 1.15 app on a 96-hyperthread machine (during a load test, so it's especially busy). I'll walk through my understanding of how the events it shows line up with the code inruntime.gcMarkDone
and its callees.runtime.gcMarkTermination
, https://github.com/golang/go/blob/go1.15.6/src/runtime/mgc.go#L1691runtime.startTheWorldWithSema
, called fromruntime.gcMarkTermination
, https://github.com/golang/go/blob/go1.15.6/src/runtime/mgc.go#L1752runtime.forEachP
(probably a delayed acknowledgement of the first attempt, https://github.com/golang/go/blob/go1.15.6/src/runtime/proc.go#L1333)What I see in the
perf
profiles (collected with-T
for timestamps,-g
for full call stacks, and-F 997
for about 1ms per sample) is that the process does very little work at times (only one or two CPUs worth of samples, rather than dozens), and when I see what work it's doing during those times it is inside calls fromruntime.gcMarkDone
toruntime.systemstack
toruntime.gcMarkTermination.func4
toruntime.forEachP
for several samples in a row.CC @aclements @mknyszek